It's good to be at Week 8 because we can now start to look at some in-season data and draw conclusions. While we still have a small sample size, the context is we have more than 40 percent of the season in the books.
The first position I will look at is quarterback, specifically on FanDuel. This is a position that offers two types of strategies: take the best QB in the top three for the week or look for the best mid-priced player based on matchups.
I usually don't go below $7,000 in cash games. The history shows that when you do, the likelihood of the QB busting is higher compared to any other range.
The strategy on FanDuel is usually to pay up for the best player and matchup because of the way the salaries are structured from top to bottom. If you can get one of the studs (Brady/Rodgers/Brees at home) usually they are favored with a high total. If one of them is not a play, then I look at the mid-tier with a good matchup and someone who is most likely to have 40 attempts.
One of the nuances with quarterbacks on FanDuel is there is not a huge spread in the top vs. bottom and the percent of the QB salary vs. the $60,000 cap. The top is usually $9,000 and the bottom is $6,000. Because they raised the floor from $5,000 to $6,000 this season, it has made anything less than $7,000 a high-risk play and usually not worth it. Also, because it is a 0.5 PPR, we know that the scoring for other skill position players will be less, so the top-tier QBs become even more important.
This chart shows where the best value for QB has been so far through Week 6:
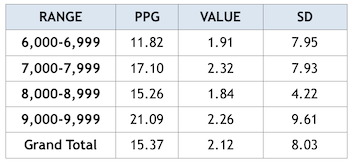
The only difference in quarterback scoring on FanDuel and DraftKings is the three-point bonus on DK for 300 yards passing. So when you are looking at an average of about 20 points at the position vs. a cash game target score on FD of 120 (13 percent) vs. a target score of 150 on DK (10 percent), you can see why it is more important to nail the position on FanDuel.
I usually project out a minimum of 20 points of what I need from the position regardless of it being cash or tournaments. From there, I look at what the potential ceiling is for the player. I get the ceiling possibility by looking at the player history over the last season and current season, but I also look at the opposing defense and if they have been allowing big games to quarterbacks.
From a value perspective, I need at least 3x value in tournaments to consider a quarterback. This is where matchups, Vegas, and price all come into play. It's much easier to find a $7,000 QB to hit 21 points than it is for a $9,000 QB to hit 27 points. Once you get beyond a 300-yard passing, two-TD projection (20 points), it then comes down to: can he hit 350 or 400 yards? Can he hit three or four TDs? Is there a rushing angle in play? One rushing TD and 50 yards is 11 points. That's just about 300 yards passing if you look at it that way.
Another factor that can play into your quarterback decision are looking at home/road splits. Some QBs have a significant difference when playing at home – think Drew Brees, Ben Roethlisberger, Tyrod Taylor, Aaron Rodgers.
Now let's look at QBs by the numbers and see what conclusions we can draw.
Top 12 – Points
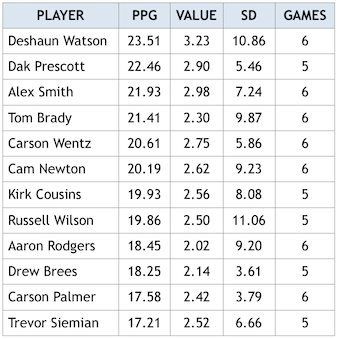
As you can see there is not a huge spread in PPG between the top QB (Watson) and the 12th (Siemian). Would you have predicted Watson, Prescott, Smith, and Wentz be top-five quarterbacks after Week 6? For cash games, you want someone in the Top 12 with the lowest standard deviation. The best cash-game plays from this group are Prescott, Wentz, Brees and Palmer. Sometimes a high standard deviation could make a QB appealing for both cash games and GPPs, like a Watson or Brady because they have such a high floor.
Bottom 12 – Points
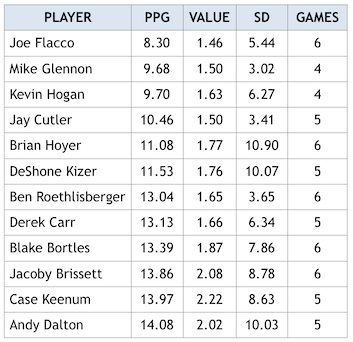
The biggest surprise is Roethlisberger, who's not only averaged 13.04 PPG, but his standard deviation is 3.65 – which suggests every game he has played has been subpar. While guys like Hoyer, Kizer and Dalton have had some great games, most have been below average.
Top 12 – Value
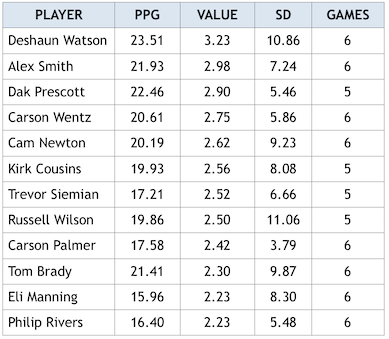
The majority of this group was also in the Top 12 PPG, but Manning and Rivers sneak in here at 2.23x value. This just goes to show how the position is grouped so heavily in the middle of the pack.
Bottom 12 – Value
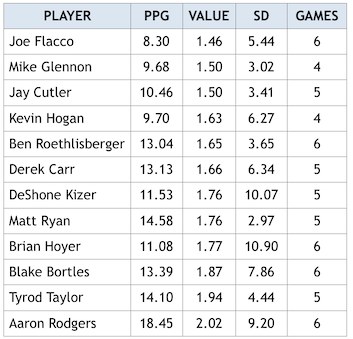
Matt Ryan and Aaron Rodgers (though the game he got injured impacts his stats) have provided 2x value or less this year, on average. Ryan certainly has been the biggest disappointment with the change in offensive coordinators really showing an impact.
Defenses
Top 12 – PPG allowed
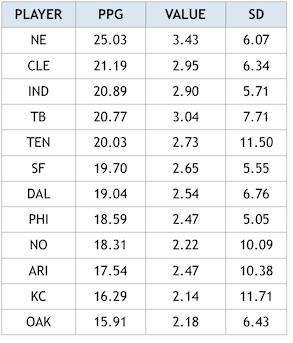
We saw this play out in Week 7 with Bortles vs. the Colts, Taylor vs. the Bucs, and Prescott vs. the 49ers – where all posted big games.
Bottom 12 – PPG allowed
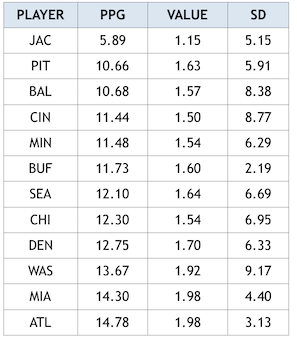
I can't remember a D/ST being so dominant against opposing QBs like the Jaguars have been this year. They are almost a full five points better than the next best option. Ironically, three of the top four teams are from the same division (AFC North).


