This article is not the first time I have looked at fastball velocity at RotoWire (and elsewhere). A couple years ago, I wrote this article that goes over some of the known basics. Here are the five simple rules I came up with:
1. Fastball velocity changes can be taken seriously with a minuscule sample size.
2. All pitchers will lose velocity. Be concerned if a pitcher sees a decline of more than 1.0 mph.
3. A 1.0 mph drop in velocity means a 1.1 percent drop in K% for starters and a 1.9 percent decline for relievers.
4. A 1.0 mph drop in velocity means a 0.28 point increase in ERA for starters and 0.45 increase for relievers.
5. When looking at velocity changes, make sure to check
This article is not the first time I have looked at fastball velocity at RotoWire (and elsewhere). A couple years ago, I wrote this article that goes over some of the known basics. Here are the five simple rules I came up with:
1. Fastball velocity changes can be taken seriously with a minuscule sample size.
2. All pitchers will lose velocity. Be concerned if a pitcher sees a decline of more than 1.0 mph.
3. A 1.0 mph drop in velocity means a 1.1 percent drop in K% for starters and a 1.9 percent decline for relievers.
4. A 1.0 mph drop in velocity means a 0.28 point increase in ERA for starters and 0.45 increase for relievers.
5. When looking at velocity changes, make sure to check if the pitcher is moving from one role to another. Also, make sure their fastball pitch mix hasn't changed.
These rules are simple, but it is time to add a few more to the list. The additional information comes from a couple short studies. Both of these studies originated from questions when I tweeted spring training and in-season fastball velocity changes.
FB Velo change from '15 to 4/18H Santiago +3:imageThor +2.2A Bradley +1.7C Anderson -2.5https://t.co/w2MZDRMCfgpic.twitter.com/QZrx0E6sHB
— Jeff Zimmerman (@jeffwzimmerman) April 19, 2016
The two questions are:
• How much stock should we have in spring training velocity as pitchers warm up?
• How much should we take into account the cold weather and/or early drop in velocity?
Let me start with the first question. While spring training velocity is no longer needed, it can be used next season and to look back at this season.
For spring training velocity, I looked at a pitcher's velocity in the first 15 days of March, the next 15 days and the season's first two weeks. I wanted to see if a low velocity was indicative of pitcher getting up to speed.
For my dataset, I looked at pitchers from 2016 who were on the Rangers, Royals, Padres, Diamondbacks, Mariners and Rockies. The reason I selected these six teams is their spring training home parks have Pitchf/x and Trackman velocity values available. These pitchers were likely to have multiple readings.
Then, I compared their velocity changes (via Brooks Baseball) over each time frame. Here are the surprising results:
| SEASON - SPRING 1st HALF | SEASON - SPRING 2nd HALF | SPRING 1st HALF - 2nd HALF | |
| Average | -0.37 | -0.14 | -0.23 |
| Median | -0.59 | 0.08 | -0.19 |
| Standard Deviation | 1.05 | 0.88 | 1.11 |
I rechecked the numbers, and these 64 pitchers saw an average drop in velocity from the beginning of spring training vs. regular season. There is almost no change from the second half of spring training vs. regular season with the average value barely less and the median just up. Also, the range of velocity differences shrunk in this timeframe to a standard deviation of less than 1 mph.
I would definitely take more stock in second-half spring training values, and they should be a good measure of velocity moving into the season.
The best reason I can think of for pitchers throwing harder at the beginning of spring training is that starters are only going an inning or two. The starters can then give it their all for an inning or two and then shut it down. Another possibility is some pitchers get banged up or discover an injury and their results decline.
Velocity and Weather
Now, time to move onto early season velocity and how much should we expect it to change over the course of a season.
I will start with a previous study of mine I published at FanGraphs where I looked at cold weather effects.
Basically, I found that a pitcher should expect to lose between 0.6 mph and 0.9 mph when pitching on a cold day. Truthfully, the data dump created more questions than answers because April is cold and the data doesn't compare values over several months. Well, it is time to correct those deficiencies.
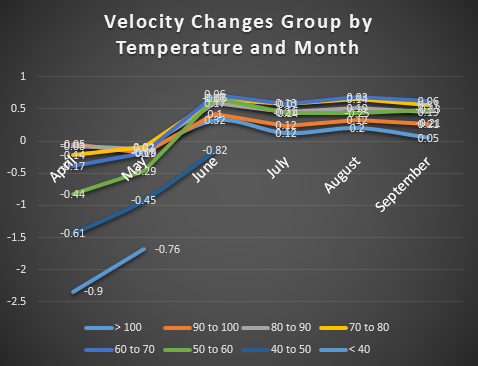
Here are a graph and table of velocity difference at set temperature ranges over the course of the season (Pitchf/x data from 2008 to 2015).

| TEMP | APRIL | MAY | JUNE | JULY | AUGUST | SEPTEMBER |
| > 100 | NA | -0.19 | 0.32 | 0.12 | 0.20 | 0.05 |
| 90 to 100 | -0.05 | 0.00 | 0.10 | 0.12 | 0.12 | 0.21 |
| 80 to 90 | -0.03 | 0.07 | 0.17 | 0.21 | 0.19 | 0.19 |
| 70 to 80 | -0.14 | 0.02 | 0.07 | 0.13 | 0.14 | 0.11 |
| 60 to 70 | -0.17 | -0.08 | 0.06 | -0.01 | 0.03 | 0.06 |
| 50 to 60 | -0.44 | -0.29 | -0.05 | -0.14 | -0.25 | -0.13 |
| 40 to 50 | -0.61 | -0.45 | -0.82 | NA | NA | -0.21 |
| < 40 | -0.9 | -0.76 | NA | NA | NA | NA |
Well, it is true that lower temperatures mean lower velocities as seen by the values between 40 and 60 degrees. Also, there is some increase over the course of the season. The velocity increases are generally fairly small compared to some of the changes pitchers see. The increase from April to June is just over 0.1 mph and just over 0.2 mph from April to June. After June, the velocities seem to stabilize.
Now by combining the two studies, we can show pitcher velocity is lower in spring training than the overall regular season, but not by much.
The instances of when a pitcher throws at temperatures 60 degrees or colder should be used to adjust his velocity up or not used at all. Even after adjusting for temperature, pitchers should expect a velocity increase of 0.20 to 0.25 mph until June when their velocity settles out.
With this information, my five rules of velocity is now eight:
1. Fastball velocity changes can be taken seriously with a minuscule sample size.
2. All pitchers will lose velocity. Be concerned if a pitcher sees a decline of more than 1.0 mph.
3. A 1.0 mph drop in velocity means a 1.1 percent drop in K% for starters and a 1.9 percent decline for relievers.
4. A 1.0 mph drop in velocity means a 0.28 point increase in ERA for starters and 0.45 increase for relievers.
5. When looking at velocity changes, make sure to check if the pitcher is moving from one role to another. Also, make sure their fastball pitch mix hasn't changed.
6. A pitcher's April velocity likely will mirror his late spring training velocity.
7. Pitchers are likely to see at least a .20 to .25 velocity increase from April to June depending on games temperatures. If they pitched in cold games, it could be more.
8. Pitchers can lose from ~0.5 to 1.0 mph from their fastball on temperatures lower than 50 degrees.
Well, that is it for this week. Hopefully, I don't have to revisit fastball velocity for a while. I have shown when to use spring training velocities. Also, I split apart the effects of the early season and cold temperatures. While there are some adjustments that need to be used in the early season, the adjustments are huge. Finally, let me know if you have questions on the subject.


