I believe plate discipline is still one of the most undervalued traits in the game. A batter's ability to identify which pitches are strikes and balls will help him make solid contact because he is swinging at better pitches.
Another frequently cited issue is walks and strikeouts don't directly help a fantasy team's production. There are several nice and subtle way they help, however. With walks, it helps in on-base percentage leagues and also help with producing runs and stolen bases. Lowering strikeouts have even better results, like a better batting average (some of the batted balls will turn into hits) and the additional runs and RBI produced.
The one item often brought up is that a player is sacrificing contact for power. I decided to run a little study. Using K%-BB% as my proxy for plate discipline, I found the hitters who improved or got worse by
I believe plate discipline is still one of the most undervalued traits in the game. A batter's ability to identify which pitches are strikes and balls will help him make solid contact because he is swinging at better pitches.
Another frequently cited issue is walks and strikeouts don't directly help a fantasy team's production. There are several nice and subtle way they help, however. With walks, it helps in on-base percentage leagues and also help with producing runs and stolen bases. Lowering strikeouts have even better results, like a better batting average (some of the batted balls will turn into hits) and the additional runs and RBI produced.
The one item often brought up is that a player is sacrificing contact for power. I decided to run a little study. Using K%-BB% as my proxy for plate discipline, I found the hitters who improved or got worse by one standard deviation. I looked at how these hitters' isolated power (ISO) changed for the four groups. Here are the results:
| PLATE DISCIPLINE | MEDIAN CHANGE |
| >1 SD worse | 0.000 |
| < 1 SD worse | -0.005 |
| < 1 SD better | -0.004 |
| >1 SD better | -0.004 |
Not much changed in power at all as plate discipline changed.
As I said, I used K%-BB% to help determine total change. I don't see a problem with using K/BB or even K%. With the combined K%-BB% stat, it is a little helpful to know how it ages. Here is an aging curve for K%-BB%.
The aging curve was created by the delta method by weighting plate appearances using their harmonic means. With this method, there's a small survivor bias, which was summarized in an article by Mitchel Lichtman at The Hardball Times:
"I have also explained the problem of survivor bias, an inherent defect in the delta method, which is that the pool of players who see the light of day at the end of a season (and live to play another day the following year) tend to have gotten lucky in Year 1 and will see a "false" drop in Year 2 even if their true talent were to remain the same. This survivor bias will tend to push down the overall peak age and magnify the decrease in performance (or mitigate the increase) at all age intervals."
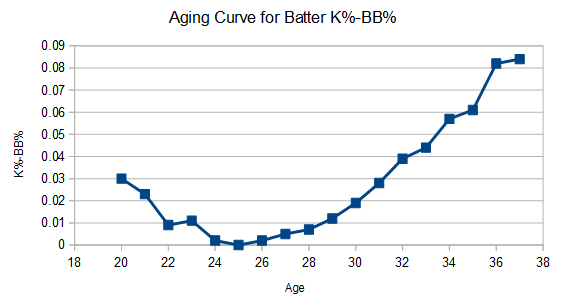
The key is that overall plate discipline improves until age 25 and then slowly declines to age 28 and then drops significantly.
Finally, time for the biggest 2015 to 2016 movers, and remember, a bigger change value is worse because K% got bigger and/or BB% got smaller.
(Click column headings to sort.)
Biggest Descrease in Plate Discipline
| PLAYER | TOTAL CHANGE | YEAR | AGE | PA | K% | BB% | YEAR | AGE | PA | K% | BB% |
|---|---|---|---|---|---|---|---|---|---|---|---|
| Carlos Gomez | 12.7 | 2016 | 30 | 220 | 37.2 | 7.7 | 2015 | 29 | 477 | 23.2 | 6.5 |
| Alex Rodriguez | 12.7 | 2016 | 40 | 178 | 31.9 | 5.1 | 2015 | 39 | 620 | 27.7 | 13.5 |
| Mike Napoli | 12.5 | 2016 | 34 | 300 | 38.7 | 9.3 | 2015 | 33 | 469 | 29.0 | 12.2 |
| Chris Coghlan | 12.4 | 2016 | 31 | 213 | 32.1 | 9.9 | 2015 | 30 | 503 | 21.4 | 11.5 |
| Alex Gordon | 11.5 | 2016 | 32 | 179 | 34.8 | 8.9 | 2015 | 31 | 422 | 26.0 | 11.6 |
| Anthony Gose | 11.4 | 2016 | 25 | 101 | 41.8 | 8.9 | 2015 | 24 | 535 | 29.9 | 8.4 |
| Russell Martin | 10.7 | 2016 | 33 | 239 | 33.5 | 9.2 | 2015 | 32 | 507 | 24.0 | 10.5 |
| Joey Votto | 10.4 | 2016 | 32 | 314 | 30.2 | 15.6 | 2015 | 31 | 695 | 24.8 | 20.6 |
| Mark Teixeira | 9.3 | 2016 | 36 | 200 | 29.2 | 11.0 | 2015 | 35 | 462 | 21.7 | 12.8 |
| Andrew McCutchen | 9.3 | 2016 | 29 | 324 | 27.7 | 9.3 | 2015 | 28 | 685 | 23.5 | 14.3 |
| Adam Lind | 9.2 | 2016 | 32 | 203 | 22.5 | 4.9 | 2015 | 31 | 572 | 19.9 | 11.5 |
| Justin Upton | 8.7 | 2016 | 28 | 302 | 34.7 | 7.6 | 2015 | 27 | 620 | 29.3 | 11.0 |
| Delino DeShields Jr. | 8.1 | 2016 | 23 | 121 | 30.2 | 9.1 | 2015 | 22 | 492 | 23.8 | 10.8 |
| Erick Aybar | 7.4 | 2016 | 32 | 213 | 20.4 | 4.7 | 2015 | 31 | 638 | 12.2 | 3.9 |
| Salvador Perez | 7.1 | 2016 | 26 | 261 | 24.4 | 4.2 | 2015 | 25 | 553 | 15.4 | 2.4 |
| James McCann | 6.8 | 2016 | 26 | 153 | 30.7 | 5.2 | 2015 | 25 | 425 | 22.4 | 3.8 |
| Freddie Freeman | 6.8 | 2016 | 26 | 325 | 28.9 | 10.2 | 2015 | 25 | 481 | 23.6 | 11.6 |
| Kurt Suzuki | 6.4 | 2016 | 32 | 174 | 18.0 | 4.0 | 2015 | 31 | 479 | 13.6 | 6.1 |
| Ryan Goins | 6.3 | 2016 | 28 | 167 | 23.4 | 4.2 | 2015 | 27 | 428 | 22.1 | 9.1 |
Biggest Increase in Plate Discipline
| PLAYER | TOTAL CHANGE | YEAR | AGE | PA | K% | BB% | YEAR | AGE | PA | K% | BB% |
|---|---|---|---|---|---|---|---|---|---|---|---|
| Brandon Belt | -13.2 | 2016 | 28 | 308 | 20.8 | 14.3 | 2015 | 27 | 556 | 29.9 | 10.1 |
| Odubel Herrera | -12.7 | 2016 | 24 | 325 | 20.7 | 12.6 | 2015 | 23 | 537 | 26.1 | 5.2 |
| Nick Hundley | -11.8 | 2016 | 32 | 119 | 17.8 | 14.3 | 2015 | 31 | 389 | 20.8 | 5.4 |
| Wilson Ramos | -10.4 | 2016 | 28 | 244 | 13.3 | 6.6 | 2015 | 27 | 504 | 21.3 | 4.2 |
| Nolan Arenado | -9.9 | 2016 | 25 | 332 | 13.7 | 10.8 | 2015 | 24 | 665 | 17.9 | 5.1 |
| Chris Owings | -9.7 | 2016 | 24 | 196 | 21.2 | 7.7 | 2015 | 23 | 552 | 28.0 | 4.7 |
| Ichiro Suzuki | -9.6 | 2016 | 42 | 166 | 7.5 | 11.4 | 2015 | 41 | 438 | 12.8 | 7.1 |
| Randal Grichuk | -9.3 | 2016 | 24 | 225 | 26.5 | 8.0 | 2015 | 23 | 350 | 34.1 | 6.3 |
| Matt Carpenter | -9.0 | 2016 | 30 | 315 | 21.0 | 15.9 | 2015 | 29 | 665 | 26.3 | 12.2 |
| Jorge Soler | -8.6 | 2016 | 24 | 152 | 27.7 | 11.2 | 2015 | 23 | 404 | 33.1 | 7.9 |
| Steve Pearce | -8.2 | 2016 | 33 | 196 | 18.4 | 10.2 | 2015 | 32 | 325 | 23.5 | 7.1 |
| Kris Bryant | -8.1 | 2016 | 24 | 327 | 26.1 | 10.4 | 2015 | 23 | 650 | 35.6 | 11.8 |
| Kole Calhoun | -8.0 | 2016 | 28 | 327 | 20.7 | 9.2 | 2015 | 27 | 686 | 26.0 | 6.6 |
| Cameron Maybin | -7.4 | 2016 | 29 | 147 | 13.5 | 8.8 | 2015 | 28 | 555 | 20.2 | 8.1 |
| C.J. Cron | -7.3 | 2016 | 26 | 245 | 16.7 | 6.5 | 2015 | 25 | 404 | 21.7 | 4.2 |
| DJ LeMahieu | -7.1 | 2016 | 27 | 297 | 13.6 | 9.8 | 2015 | 26 | 620 | 19.0 | 8.1 |
| Ian Desmond | -7.0 | 2016 | 30 | 327 | 25.1 | 7.0 | 2015 | 29 | 641 | 32.1 | 7.0 |
| Austin Jackson | -7.0 | 2016 | 29 | 203 | 21.5 | 8.4 | 2015 | 28 | 527 | 25.7 | 5.5 |
| Jordy Mercer | -7.0 | 2016 | 29 | 293 | 15.9 | 10.6 | 2015 | 28 | 430 | 18.5 | 6.3 |
| J.J. Hardy | -6.7 | 2016 | 33 | 121 | 15.0 | 5.0 | 2015 | 32 | 437 | 21.4 | 4.6 |
Decliners
Overall: Eight of the 10 decliners are older than 30. Of the players who improved, only three are older than 30. As the aging curve shows, hitters most likely to see their plate discipline dissolve are older players.
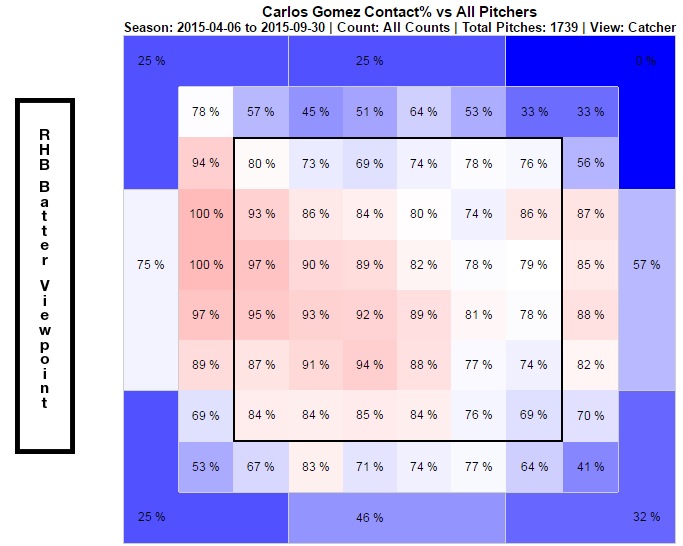
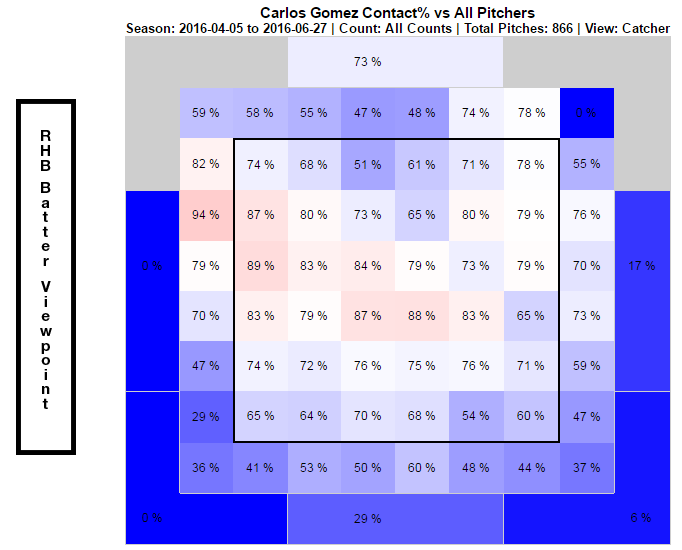
Carlos Gomez: Gomez has just fallen apart this year. Almost all of his problem come down to his inability to make contact. His contact rate has gone from 77 percent last year (75 percent career average) to 65 percent this season. The difference can be seen in these heat maps of his 2015 and 2016 contact rates.
Improvers
Joey Votto: This may be the year Votto doesn't lead the league in walks (used 250 PA in 2014 because he was out with injury). Looking at his swing-and-contact numbers, the cause isn't obvious. He is swinging the same and making the same amount of contact. The biggest change is the pitchers are attacking him in the strike zone more (47 percent of the time, highest since 2008) and he is just having to swing more. The 32-year-old Votto has not been able to make pitchers pay for pitching him in the zone.
Alex Gordon: The basic issue with Gordon is that he is not making contact (78 to 69 percent). Looking various heat maps and tendencies at Brooksbaseball.net, it isn't just one issue. He is missing more on all three pitch types (fastball, breaking, offspeed). His miss rates are up across the entire strike zone. I think age and its effects are catching up with him.
Improvers
Brandon Belt: What an improvement by Belt. If you look into his batted ball stats, he is performing worse than in 2015 with his BABIP (.363 to .340) and HR/FB (14 to 10 percent) down. The improvement, raising his BB% by 4 points and dropping his K% by 9 points, has led to some significant results. He changed by following the simple rule of swinging less at pitches out of the strike zone (31 to 27 percent) and making more contact at pitches in the zone (74 to 79 percent). His improvement could end up being the best among qualified hitters since Bonds in 2003.
Kris Bryant, Matt Carpenter: It's not like both were scrubs before the improvements, but the changes have taken them to new heights.
Odubel Herrera: Herrera was a nice story last season when he was able to be productive enough to stick as the Phillies' Rule 5 selection. This season's more than 50-point jump in OBP (.344 to .397) has been huge for his production. He is hitting leadoff and thereby getting more plate appearances. Additionally, the extra times on base have helped increase his stolen bases and runs scored


