Many of us picked up some habits in recent years that were mostly carryover from the period of time when we were asked to stay home for the betterment of all. I picked up a few hobbies in that time such as breadmaking, playing Strat-o-Matic for the first time, and writing about early power indicators during the second week of April. I looked back into my article archive and found that I have written about this topic, this same week in April, in four of the past five seasons.
The instigator of the first article was a piece in The Ringer by Ben Lindbergh wondering if the 2021 baseball was still juiced from 2019. The early data from that season pointed to the league potentially hitting 6,200 home runs that season, which would have been the second-highest total in recent seasons at that time. The final total came in at 5,944, falling four percent below projections. Last year, when I looked back at recent seasons, 2024 gave us the most variability for PA/HR (home runs per plate appearance) from the early data to the final data. The league was hitting a home run every 37.3 plate appearances in the opening 10 days of the season, but that rate finished at one every 33.5 plate appearances by season's end. That early 37.3 number was the highest figure we had seen in recent years...until this season.
Through games played April 5, home runs have happened as infrequently as we have ever seen
Many of us picked up some habits in recent years that were mostly carryover from the period of time when we were asked to stay home for the betterment of all. I picked up a few hobbies in that time such as breadmaking, playing Strat-o-Matic for the first time, and writing about early power indicators during the second week of April. I looked back into my article archive and found that I have written about this topic, this same week in April, in four of the past five seasons.
The instigator of the first article was a piece in The Ringer by Ben Lindbergh wondering if the 2021 baseball was still juiced from 2019. The early data from that season pointed to the league potentially hitting 6,200 home runs that season, which would have been the second-highest total in recent seasons at that time. The final total came in at 5,944, falling four percent below projections. Last year, when I looked back at recent seasons, 2024 gave us the most variability for PA/HR (home runs per plate appearance) from the early data to the final data. The league was hitting a home run every 37.3 plate appearances in the opening 10 days of the season, but that rate finished at one every 33.5 plate appearances by season's end. That early 37.3 number was the highest figure we had seen in recent years...until this season.
Through games played April 5, home runs have happened as infrequently as we have ever seen early. We can blame the cool weather in some places, and Jo Adell in others. The point remains, the early returns are pointing to a tough year for home runs:
Season | Early PA/HR | Final PA/HR | Delta |
|---|---|---|---|
2016 | 36.2 | 32.9 | 10.0% |
2017 | 32.5 | 30.4 | 6.9% |
2018 | 36.1 | 33.1 | 9.1% |
2019 | 29.3 | 27.5 | 6.6% |
2020 | 30.2 | 28.9 | 4.5% |
2021 | 31.6 | 30.6 | 3.3% |
2022 | 36.9 | 34.9 | 5.7% |
2023 | 32.7 | 31.4 | 4.0% |
2024 | 37.3 | 33.5 | 10.2% |
2025 | 32.2 | 32.4 | 0.5% |
2026 | 37.7 | ?? | ?? |
2024 saw the league hit 5,453 homers, which was the second-lowest full season total, only beating out the 5,215 homers hit in 2022. Over the course of the years above, we have seen an average of 6.1 percent variance in the early PA/HR rate compared to the final season total, with a range of 0.5 percent to 10.2 percent. If we were to look at the possible range for final home run totals using the average, minimum and maximum, this is where things would shake out:
- Maximum change (10.2%) = 5,380 home runs
- Average change (6.1%) = 5,145 home runs
- Minimum change (0.5%) = 4,855 home runs
Each of those numbers would come in below the 2024 season, while two of them would even come in below the recent low-water mark of 2022. If we look at the early home run per contact ((HR/(AB-K)) for this season compared to this moment in time last season, we have seen 40 fewer homers in just four fewer contests, along with an early increase in strikeouts:
Year | Games | HR | AB | K | HR/Contact |
|---|---|---|---|---|---|
2026 | 278 | 279 | 9275 | 2496 | 4.1% |
2025 | 282 | 319 | 9391 | 2405 | 4.6% |
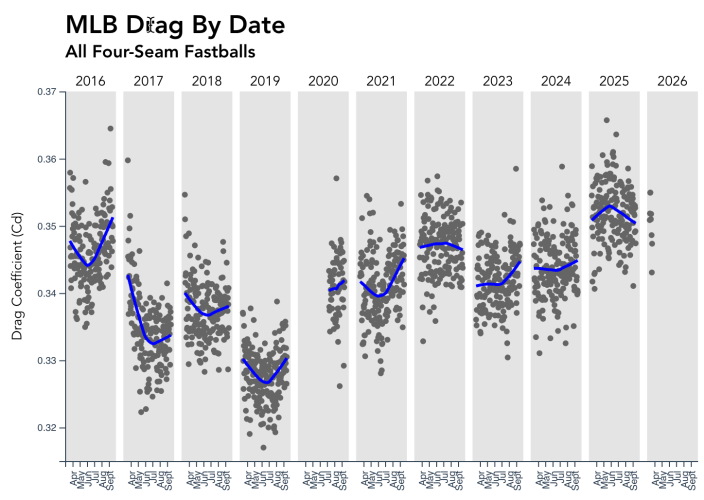
It is not hard to understand why we're seeing slow early returns on home runs, because the drag on the baseball is very much in line with last year as well as that sluggish 2022 season:
I was confidently able to state, "It should be an assumed fact by now that we will have more home runs this season than we had last season," in last year's article based off the data at hand. I feel as confident stating the opposite for 2026, that we will see fewer home runs hit in 2026 than we saw hit in 2025. I believe that will lead to a resurgence in stolen bases this season as teams look to manufacture the runs that are being lost to fewer home runs. We are already seeing signs of that resurgence, with Milwaukee attempting 24 steals in the first nine games of th season while both the Yankees and the surprising Rockies have each already attempted 15 steals.
I said two weeks ago that I believed steals would be up in 2026, and this sluggish start for home runs in 2026 would make me want to aggressively double down on that statement if I were a betting man. I'll even go as far to say I believe we will have multiple players steal 50-plus bases this season, while we may not even see one batter hit 50 homers.