Pencils down, time's up. The season is over.
It's time to finish the story on the 2024 run-scoring environment and look to 2025. As has been done most of the summer, runs per game, home run rate, average fly ball distance and BABIP (batting average on balls in play) will be examined. Now that all the precincts have reported, the results can be compared to past seasons.
The methodology is a little different for this final study. The metric after each day of the season will be presented. That is, the average runs per game on Opening Day will be followed by the level after two days, then three days, etc. It isn't each individual day or month. As such, the early data is choppier, since the sample is so small. In order for the level to move at the end, the daily average needs to be significantly different than the average to that point.
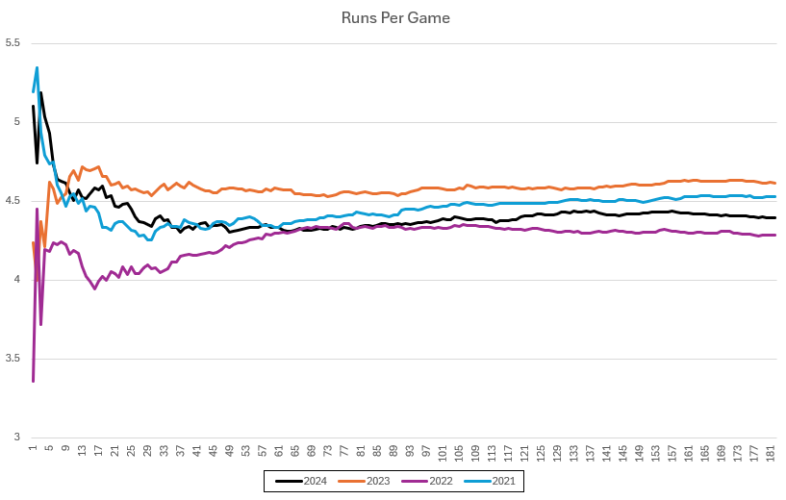
After the runs per game dropped in 2022, MLB had enough with the shift and plodding nature of the game. Legal fielding positions were defined, and every pitch would be subject to a timer. The bases were enlarged and disengagements from the pitching rubber were limited.
The result was the highest scoring since the pandemic season. Keep in the mind the season previous to that featured the happy fun ball.
The increase in scoring did not carry over to this season. No new rules were introduced, so why the drop in players crossing the plate?
Pencils down, time's up. The season is over.
It's time to finish the story on the 2024 run-scoring environment and look to 2025. As has been done most of the summer, runs per game, home run rate, average fly ball distance and BABIP (batting average on balls in play) will be examined. Now that all the precincts have reported, the results can be compared to past seasons.
The methodology is a little different for this final study. The metric after each day of the season will be presented. That is, the average runs per game on Opening Day will be followed by the level after two days, then three days, etc. It isn't each individual day or month. As such, the early data is choppier, since the sample is so small. In order for the level to move at the end, the daily average needs to be significantly different than the average to that point.
After the runs per game dropped in 2022, MLB had enough with the shift and plodding nature of the game. Legal fielding positions were defined, and every pitch would be subject to a timer. The bases were enlarged and disengagements from the pitching rubber were limited.
The result was the highest scoring since the pandemic season. Keep in the mind the season previous to that featured the happy fun ball.
The increase in scoring did not carry over to this season. No new rules were introduced, so why the drop in players crossing the plate?
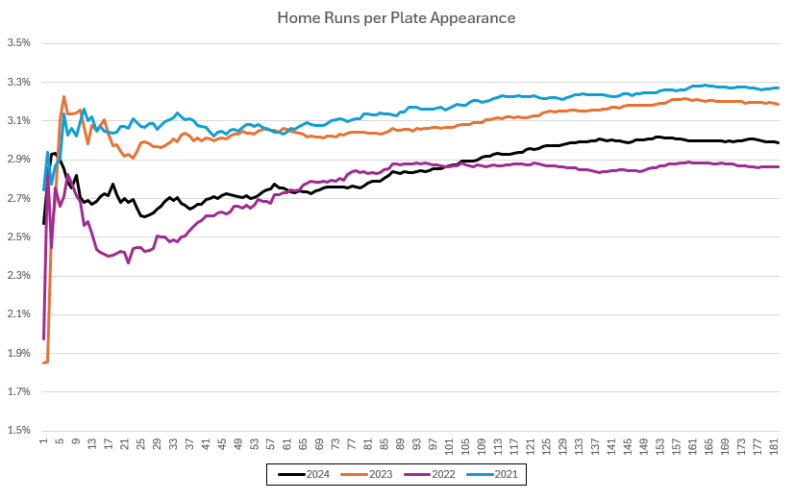
While there isn't a direct correlation over the period studied, scoring and homers were lowest in 2022 while they were each second lowest this season. In 2021 and 2023 however, they weren't in sync.
Let's dig into the 2024 home run rate. The current fad is to use Barrel% as a leading indicator. Barrel% is defined as the percentage of batted balls with an exit velocity of at least 95 mph and a launch angle between 10 and 35 degrees. Here is the data from the past four seasons.
| Season | Barrel% | HR/PA |
|---|---|---|
| 2024 | 18.2% | 3.0% |
| 2023 | 18.6% | 3.2% |
| 2022 | 18.0% | 2.9% |
| 2021 | 18.2% | 3.3% |
The correlation is a solid, but not overwhelming 0.62.
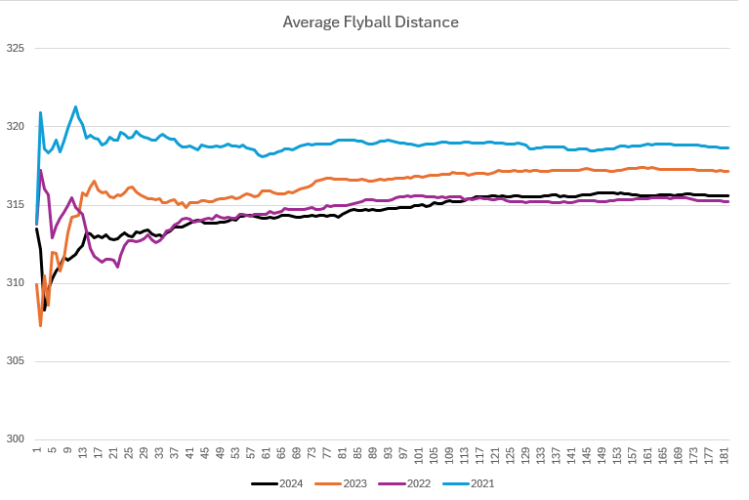
I have always been a fan of a study published on Fangraphs in which colleague Mike Podhorzer demonstrated a strong relationship between Home Run Rate and average fly ball distance.
| Season | Avg FB Dist | HR/PA |
|---|---|---|
| 2024 | 316.5' | 3.0% |
| 2023 | 318.4' | 3.2% |
| 2022 | 316.5' | 2.9% |
| 2021 | 320.3' | 3.3% |
The correlation here is a more convincing 0.93. Simply put, long balls were down because the ball did not travel as far this season.
There are various reasons influencing the distance a ball travels. The primary two are the weather and the construction of the ball. Hopefully, someone will do a study on the temperature and humidity relative to other years. That's a study beyond the scope of what I want to undertake in the offseason. The characteristics of the baseball in 2019 were extensively studied, and sure enough physical reasons explaining why the ball traveled further were unveiled. Maybe they are out there this season, but I haven't encountered similar studies. There are rumblings that MLB was less cooperative this season, and acquiring balls to study was difficult.
From a fantasy perspective, knowing how the 2025 ball will play would be hugely beneficial. There are subsets of hitters and pitchers more or less affected by average fly ball distance. I'll address those topics over the offseason, though the likelihood is we'll be in the dark until pitchers start throwing and batters start swinging.
Speaking of which, I wonder if spring stats are useful. It's been shown that they're not helpful on an individual player basis, but what about leaguewide? Here are the Home Run Rates from the spring and regular season over the past four seasons.
| Year | Spring | Regular |
|---|---|---|
| 2024 | 2.8% | 3.0% |
| 2023 | 2.9% | 3.2% |
| 2022 | 3.6% | 2.9% |
| 2021 | 3.2% | 3.3% |
Keep in mind that the 2022 season included the condensed spring after the extended CBA negotiations. Spring homers were more prevalent relative to the regular season that year. In the other three, regular season homers picked up over the spring numbers. It's only three years, but the correlation is an impressive 0.84. Only three data points feels too light to draw a definitive conclusion, but the high correlation begs a longer study. We may not get a feel for how the ball is playing until late in the spring, but there are still plenty of drafts that could benefit.
Let's shift attention (pun intended) to BABIP.
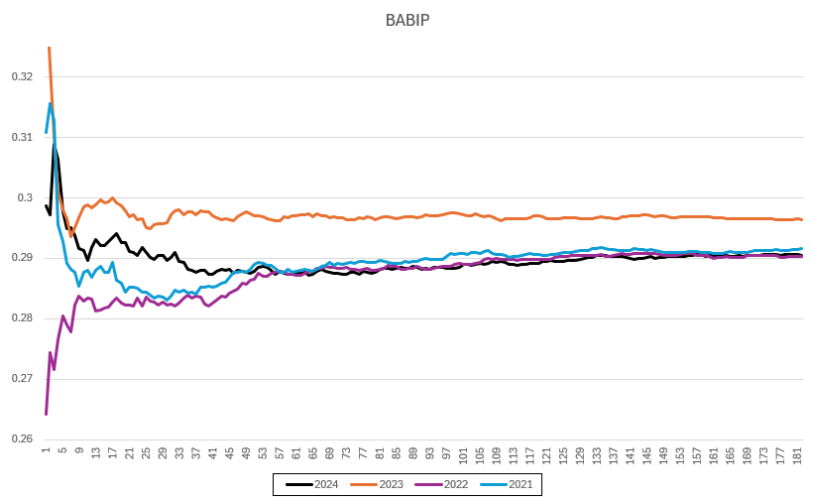
Last season, the BABIP was higher than the other three years. Hmm, I wonder why? Could it be the first season after shift legislation? You bet your bippy that's the reason.
If that's the case, why did the 2024 BABIP join the 2021 and 2022 cluster?
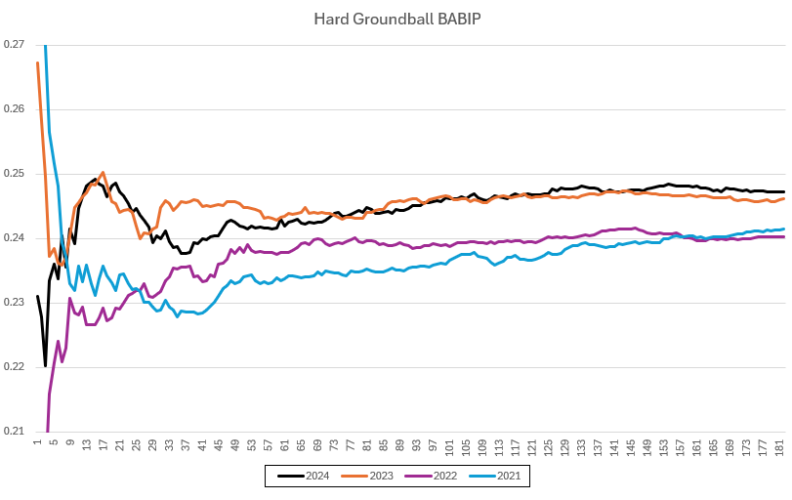
Hard groundball BABIP shows two distinct levels: pre and post shift legislation. However, the overall 2024 BABIP was grouped with 2021 and 2022.
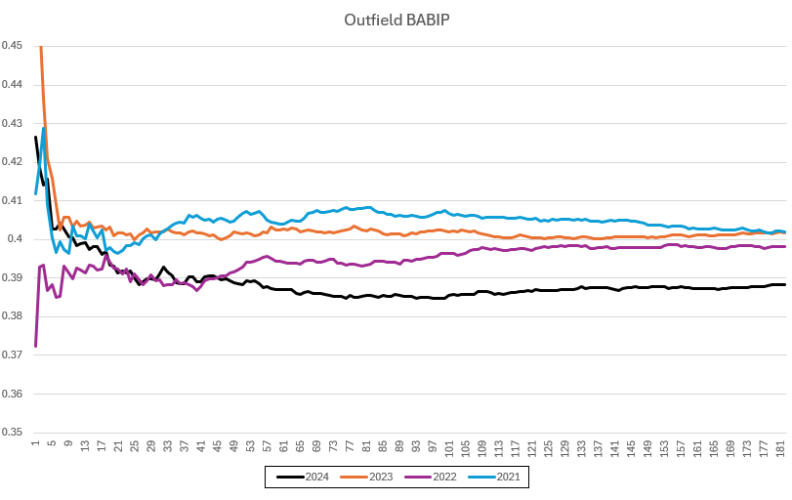
The data combines flyballs and outfield line drives. Note how the outfield BABIP from this past season is noticeably lower than the prior three campaigns, driving the overall BABIP down.
The 2023 outfield BABIP dipped a tad, perhaps due to shift legislation as teams would often deploy a rover-like infielder in right field. Even so, this season's drop is stark.
One explanation could be teams adjusting positioning once it became known the baseball wasn't traveling as far, allowing outfielders to cut off shallower contact while still having the ability to chase down balls hit over their head.
Another is that teams are deploying better athletes to better take advantage of the rules implemented in 2023. Base stealing is up; perhaps teams are leaning toward players with more speed, which translates to superior outfield defense. Plus, without the shift, there is less of a focus on swinging from the heels, which also benefits players who are probably better defenders.
Either theory benefits flyball pitchers, since more lofted contact will find leather. Inducing groundballs is viewed as a skill; I prefer to approach it as a trait. More grounders are getting through, while fewer flyballs are landing safely. As always, grounders can also result in a double play and unless it's a very rare inside-the-parker, groundballs are never four-baggers. Even so, in today's environment, there is less benefit to being a groundball pitcher.
This puts a bow on 2024. It's onto 2025. But before I go, here is a table of end-of-season data for the graphs presented above.
| Season | Runs per game | HR/PA | Avg. FB Dist. | BABIP | HGB BABIP | OF BABIP |
|---|---|---|---|---|---|---|
| 2024 | 4.39 | 3.0% | 315.6' | .291 | .247 | .388 |
| 2023 | 4.62 | 3.2% | 317.2' | .296 | .246 | .402 |
| 2022 | 4.28 | 2.9% | 315.2' | .290 | .240 | .398 |
| 2021 | 4.53 | 3.3% | 318.6' | .292 | .241 | .402 |