
Every spring, the Stanley Cup Playoffs rewrite the script. Regular-season point totals stop mattering, ice time gets redistributed and role players turn into difference-makers while stars go quiet. To measure who actually changed once the 2026 NHL playoffs began -- not just who scored -- we built a Surprise Score that compares each skater and goalie to his own regular-season baseline across three dimensions: scoring, play-driving and ice time.
The result is a single leaderboard of the biggest 2026 NHL playoff risers and fallers across all positions. Forwards, defensemen and goalies are each graded against their own peers, so a shutdown defenseman who tilted the ice counts as much as a winger who piled up points. Below are the full Top 15 lists, the players who drove them and exactly how the metric works.
With a number of sportsbook promos available on highly rated sports betting apps like BetMGM, DraftKings, FanDuel and others, there's never been a better time to start wagering on hockey odds ahead of next season.
2026 NHL Playoff Risers and Fallers at a Glance
Top 15 Risers
# | Player (Team) | Pos | Surprise | Key drivers |
1 | Kasperi Kapanen (EDM) | RW | +2.07 | P/GP +0.59, CF%-rel +10.1, TOI +3.3 min |
2 | Kailer Yamamoto (UTA) | RW | +1.99 | P/GP +0.44, CF%-rel +15.4, TOI +2.5 min |
3 | Matt Duchene (DAL) | C | +1.84 | P/GP +0.71, CF%-rel −1.1, TOI +4.4 min |
4 | Frederik Andersen (CAR) | G | +1.79 | SV% +.036, GSAA +2.5 |
5 | Brett Howden (VEG) | C | +1.52 | P/GP +0.44, CF%-rel +7.9, TOI +1.7 min |
6 | Brock Faber (MIN) | D | +1.49 | P/GP +0.27, CF%-rel +8.4, TOI +5.1 min |
7 | Dan Vladar (PHI) | G | +1.43 | SV% +.016, GSAA +5.7 |
8 | Taylor Hall (CAR) | LW | +1.39 | P/GP +0.40, CF%-rel +6.2, TOI +2.0 min |
9 | Vasily Podkolzin (EDM) | RW | +1.34 | P/GP +0.55, CF%-rel +2.1, TOI +0.9 min |
10 | Brandon Hagel (TBL) | LW | +1.25 | P/GP +0.10, CF%-rel +7.5, TOI +5.1 min |
11 | Devon Toews (COL) | D | +1.24 | P/GP +0.49, CF%-rel +3.2, TOI +3.3 min |
12 | Quinn Hughes (MIN) | D | +1.20 | P/GP +0.34, CF%-rel +5.7, TOI +3.2 min |
13 | Dylan Guenther (UTA) | RW | +1.15 | P/GP −0.09, CF%-rel +16.0, TOI +3.4 min |
14 | Gabriel Landeskog (COL) | LW | +1.10 | P/GP +0.26, CF%-rel +3.3, TOI +2.9 min |
15 | Jackson Blake (CAR) | RW | +1.05 | P/GP +0.40, CF%-rel +0.7, TOI +1.4 min |
After a careful assessment of the articles, tips and calculators on RotoWire, you can begin wagering on hockey odds at the top-rated NHL betting sites in the US.
Top 15 Fallers
# | Player (Team) | Pos | Surprise | Key drivers |
1 | Matvei Michkov (PHI) | RW | −1.70 | P/GP −0.50, CF%-rel −12.2, TOI −3.0 min |
2 | Anthony Mantha (PIT) | RW | −1.62 | P/GP −0.62, CF%-rel −9.5, TOI −1.6 min |
3 | Connor McDavid (EDM) | C | −1.43 | P/GP −0.68, CF%-rel −8.0, TOI +0.6 min |
4 | Lukáš Dostál (ANA) | G | −1.37 | SV% −.018, GSAA −9.3 |
5 | Brock Nelson (COL) | C | −1.30 | P/GP −0.57, CF%-rel −5.1, TOI −1.5 min |
6 | Zach Hyman (EDM) | LW | −1.30 | P/GP −0.56, CF%-rel −6.0, TOI −1.2 min |
7 | Ukko-Pekka Luukkonen (BUF) | G | −1.29 | SV% −.033, GSAA −3.6 |
8 | Corey Perry (TBL) | RW | −1.25 | P/GP −0.51, CF%-rel +0.2, TOI −4.6 min |
9 | Ryan McDonagh (TBL) | D | −1.21 | P/GP −0.29, CF%-rel −14.0, TOI +0.4 min |
10 | JJ Peterka (UTA) | RW | −1.19 | P/GP −0.57, CF%-rel −1.1, TOI −2.3 min |
11 | Ben Kindel (PIT) | C | −1.11 | P/GP −0.45, CF%-rel −4.5, TOI −1.9 min |
12 | Valeri Nichushkin (COL) | RW | −1.07 | P/GP −0.35, CF%-rel −7.2, TOI −2.1 min |
13 | Zemgus Girgensons (TBL) | C | −1.04 | P/GP −0.27, CF%-rel −7.5, TOI −3.1 min |
14 | Connor Ingram (EDM) | G | −0.99 | SV% −.023, GSAA −4.1 |
15 | Mark Stone (VEG) | RW | −0.98 | P/GP −0.51, CF%-rel −5.4, TOI +0.6 min |
CF%-rel = shot-attempt share relative to teammates (play-driving). TOI = average ice time per game. SV% = save percentage; GSAA = goals saved above average. A positive Surprise Score means a player outplayed his regular-season self; a negative score means he fell short.
Biggest NHL Playoff Risers of 2026
The risers board is not a list of the best players in hockey -- it is a list of the players who climbed furthest above their own regular-season level. That is why the names at the top may surprise you.
Kasperi Kapanen,  Edmonton Oilers
Kapanen posted the single largest swing of the postseason (+2.07). His scoring jumped from 0.41 points per game in the regular season to an even 1.00 in the playoffs, and he did it while driving play -- a +10.1 jump in CF%-rel -- on roughly three and a half more minutes a night. One caution flag: a playoff PDO of 113.3 is well above the sustainable range, so some of the scoring spike was percentage-driven rather than fully repeatable.
Matt Duchene,  Dallas Stars
Duchene's rise is the kind the model trusts most. He nearly doubled his production, from 0.79 to 1.50 points per game, on a +4.4-minute usage bump -- and he did it with a playoff PDO of just 91.3, below the league baseline. When a player's scoring climbs while his luck metrics fall, the output is earned, not borrowed.
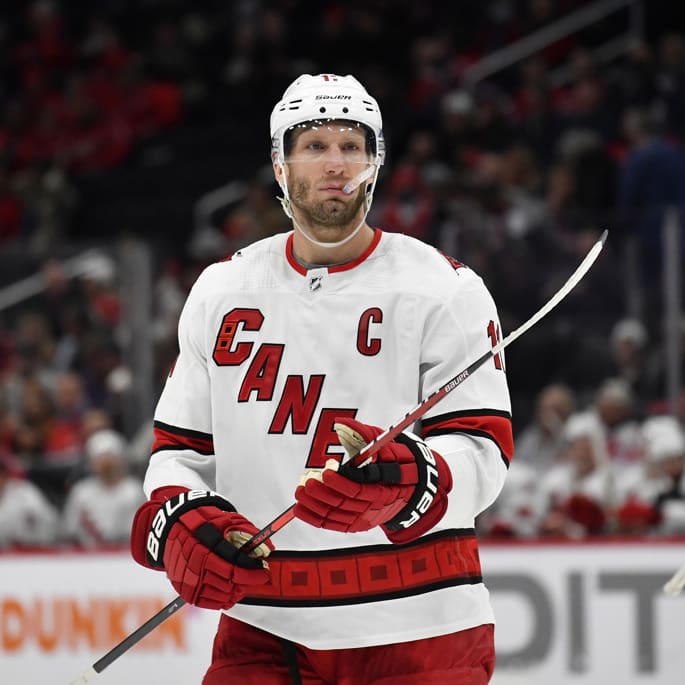
Frederik Andersen,  Carolina Hurricanes
The top goalie on the board (+1.79), Andersen lifted his save percentage from .874 in the regular season to .910 in the playoffs, worth +2.5 goals saved above average with a 56.3% quality-start rate. After an uneven regular season, he was a steadying force when Carolina needed it most.
Brock Faber,  Minnesota Wild
Faber is the prototype the Surprise Score was built to catch. His point-per-game bump was modest (0.64 to 0.91), but he absorbed a massive +5.1 minutes of additional ice time per night and improved his play-driving by +8.4 CF%-rel -- a defenseman the staff leaned on harder and who answered the bell. A points-only ranking would never surface him this high.
Dylan Guenther, Utah
Guenther is the clearest proof that points are not the whole story. His scoring actually dipped slightly (0.92 to 0.83 points per game), yet he posted a top-15 riser score because his play-driving exploded by +16.0 CF%-rel on +3.4 minutes a night — and with a PDO of 96.5, the underlying improvement reads as real. He controlled play at a far higher level even as the pucks stopped going in.
Biggest NHL Playoff Fallers of 2026
A falling Surprise Score does not always mean a bad player -- sometimes it means an elite regular season was impossible to match, and sometimes it means genuine struggles. The PDO read helps separate cold luck from real decline.
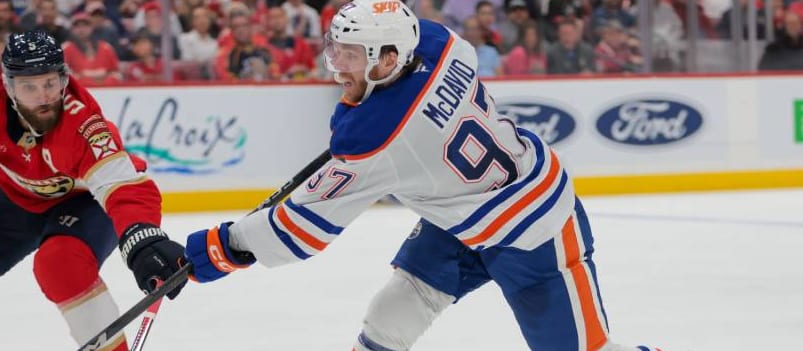
Connor McDavid Playoff Stats: A Rare Step Back
McDavid still produced at roughly a point per game (1.00) in the playoffs -- numbers most players would envy -- but that was a steep fall from his otherworldly 1.68 regular-season pace, the largest reason for his −1.43 score. His CF%-rel slipped 8.0 points, yet a playoff PDO of 90.0 suggests cold percentages dragged the line down as much as anything. This reads more like bad puck luck than a decline in his game.
Matvei Michkov,  Philadelphia Flyers
The postseason's biggest faller (−1.70), Michkov ran into a classic rookie playoff wall. His scoring cratered from 0.63 to 0.13 points per game, his play-driving fell 12.2 points of CF%-rel, and his ice time was trimmed by three minutes a night as the matchups tightened -- a difficult but common first-postseason learning curve for a high-skill young forward.
Mark Stone,  Vegas Golden Knights
Stone's production was nearly cut in half, from 1.22 to 0.71 points per game (−0.98), alongside a 5.4-point dip in CF%-rel. With a playoff PDO sitting near neutral at 99.2, there was no luck excuse -- the drop in two-way impact was real.
How We Built the Surprise Score (Methodology)
The Surprise Score measures how far a player moved from his own 2025-26 regular-season form once the 2026 playoffs began -- not how good he is in absolute terms.
For every qualified player we calculated the change between regular-season and playoff rates, then standardized each change (a z-score) within the player's position group so forwards are compared to forwards, defensemen to defensemen and goalies to goalies.
Skaters blend three standardized swings: scoring (Δ points per game), play-driving (Δ CF%-rel) and ice time (Δ TOI). Forwards are weighted 50/30/20 toward those three; defensemen are weighted 30/45/25, leaning on possession because that is the heart of the job.
Goalies are graded on the change in save percentage combined with playoff goals saved above average (GSAA), since point totals do not apply.
PDO as a sustainability check. PDO (on-ice shooting percentage plus save percentage) flags how repeatable a swing looks. A riser with a sky-high PDO likely got percentage help; a riser whose PDO is average or below -- like Duchene or Guenther -- earned it. We use PDO to annotate the results, never to inflate the score.
Data and qualifiers. All figures are sourced from Hockey-Reference and ESPN, cross-checked between the two. Skaters needed at least 40 regular-season games and 6 playoff games to qualify; goalies needed 20 regular-season and 5 playoff appearances. Scores are standardized within position and then pooled onto one leaderboard.
NHL Playoff Risers and Fallers: FAQ
Who was the most surprising player in the 2026 NHL playoffs?
Edmonton's Kasperi Kapanen had the largest positive swing, with a +2.07 Surprise Score. He lifted his scoring from 0.41 to 1.00 points per game while improving his play-driving and earning more ice time, though an unusually high PDO suggests part of the scoring jump was percentage-driven.
Which NHL stars underperformed in the 2026 playoffs?
The biggest fallers were Matvei Michkov (−1.70), Anthony Mantha (−1.62) and Connor McDavid (−1.43). In several cases the drop was relative to an elite regular-season baseline rather than a sign of poor play -- McDavid still scored at roughly a point per game.
Did Connor McDavid struggle in the 2026 playoffs?
Relatively, yes. McDavid scored about 1.00 points per game in the playoffs, down from a 1.68 regular-season pace. His on-ice shooting luck (a 90.0 PDO) was poor, which suggests the dip was driven more by cold percentages than by a decline in his underlying game.
Who was the best goalie of the 2026 NHL playoffs by improvement?
Frederik Andersen of Carolina had the largest goaltending rise, lifting his save percentage from .874 to .910 -- plus-2.5 goals saved above average -- with a 56.3% quality-start rate.
What does CF%-rel mean, and why does it matter for playoff risers?
CF%-rel is a player's share of shot attempts relative to his teammates -- a proxy for how much a team controls play with him on the ice. It matters because it credits defensemen and two-way forwards who tilt the ice without filling the scoresheet, like Brock Faber and Dylan Guenther.