Earlier this season, I determined the aging curves for running backs and wide receivers. Now the money men get their turn in the spotlight. Quarterbacks have the longest tenure in the league, so seeing their decline is less obvious. This week, we'll look at how soon to expect a quarterback to start his decline.
Quarterbacks seem to hang around forever if they are in some way productive. Most will begin with some ability to use their legs. The longer they are in the league, the more likely they stay in the pocket and get their fantasy points through the air. How does the tradeoff affect the quarterback's value as they mature? I will start by going through the process and results.
First, let me start out by restating from the previous article the process I use for acquiring and manipulating the data.
To find how these players age, I will use a process of determining aging curves that I used with baseball players called the delta method (detailed link). The aging curve was created by the delta method by chances using their harmonic means. With this method, there's a small survivor bias summarized by Mitchel Lichtman at the Hardball Times:
… survivor bias, an inherent defect in the delta method, which is that the pool of players who see the light of day at the end of a season (and live to play another day the following year) tend to have gotten lucky in Year 1 and
Earlier this season, I determined the aging curves for running backs and wide receivers. Now the money men get their turn in the spotlight. Quarterbacks have the longest tenure in the league, so seeing their decline is less obvious. This week, we'll look at how soon to expect a quarterback to start his decline.
Quarterbacks seem to hang around forever if they are in some way productive. Most will begin with some ability to use their legs. The longer they are in the league, the more likely they stay in the pocket and get their fantasy points through the air. How does the tradeoff affect the quarterback's value as they mature? I will start by going through the process and results.
First, let me start out by restating from the previous article the process I use for acquiring and manipulating the data.
To find how these players age, I will use a process of determining aging curves that I used with baseball players called the delta method (detailed link). The aging curve was created by the delta method by chances using their harmonic means. With this method, there's a small survivor bias summarized by Mitchel Lichtman at the Hardball Times:
… survivor bias, an inherent defect in the delta method, which is that the pool of players who see the light of day at the end of a season (and live to play another day the following year) tend to have gotten lucky in Year 1 and will see a "false" drop in Year 2 even if their true talent were to remain the same. This survivor bias will tend to push down the overall peak age and magnify the decrease in performance (or mitigate the increase) at all age intervals.
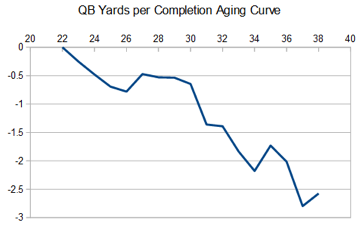
Time to start stepping through the data, which is from 2000 to 2015. I will start with the passing stats. The first two curves are completion percentage and yards per completion.
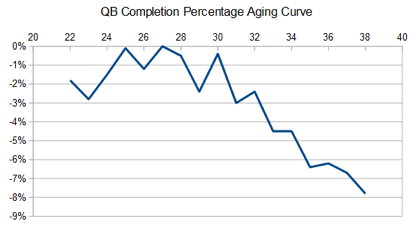
If you stare hard enough at the bumpy completion percentage aging curve there is a rise/leveling to age 30 and then a sharp decline. This doesn't surprise me because the longer a quarterback is in the league, the better he becomes at hitting the open man.
The second graph shows a nice downward slope of yards per completion with a major decline after age 30. The decline could be from quarterbacks being smarter and going for the safer route. Or it could be from them losing arm strength as they age. I bet it is a combination of the pair, but the decline does exists.
Now on to the graph that combines both the above charts, yards per attempt.
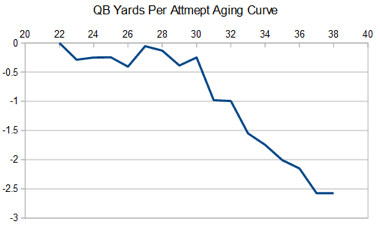
What we end up with is a fairly flat curve until the rate drops like a rock after age 30.
So with the yardage information is out of the way, the next major piece of information is touchdown passes. Here is the touchdowns per pass attempt graph.
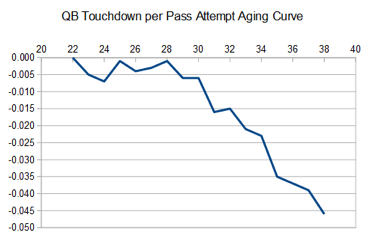
OK, the decline in touchdowns happens at age 28, which is two years before the passing yards drop. I can't think of a decent reason for this difference except the quarterback and/or coach are deferring to the running game for some reason. I really just don't know why the earlier decline.
Now for a negative input, the interception aging curve.
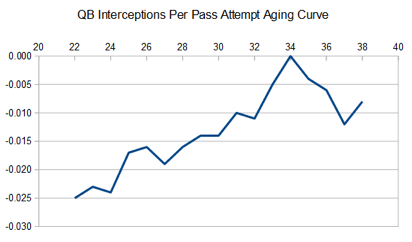
The graph is not exactly what I was expecting to see with the increasing rate until they reach age 34. I figured quarterbacks would become less pick-prone as they get older. Instead, the quarterbacks look to be forcing the ball in with possible declining physical skills until their age-34 season when they finally figure out they aren't young bucks anymore.
Next, we get to their rushing attempts. I could go into the full details like I did with running backs, but the general idea can be found in the following graph.
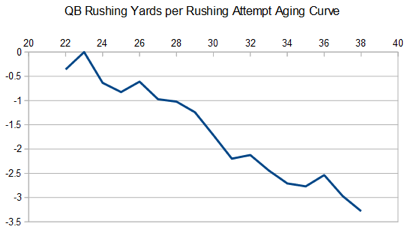
It is pretty simple, quarterbacks almost immediately start losing the ability to run just like any other athlete.
Finally, the combination of the all the preceding graphs combine into a single fantasy points aging curve.
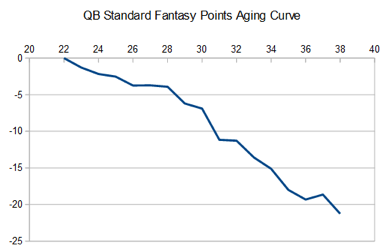
The combination of all the factors put an average quarterback on the immediate decline. The early career effects of less running and more interceptions are the initial drag. The next major drop is at 28 when the touchdowns begin to drop, and soon afterward the passing yards.
I know some quarterbacks defy this curve, like Tom Brady, but eventually, the quarterback breaks down to the point he can't keep going. Last season was a perfect example with Peyton Manning finally becoming fantasy irrelevant. Not every quarterback is a Hall of Famer and fantasy owners need to understand that their quarterback's production is likely on the decline. Quarterbacks older than 30 are the ones with every skill eroding.
Quarterbacks seem to hang around longer than the other skill positions in the league. But once they enter the league, their skills begin eroding just like any other player. The key with quarterbacks is to try to keep themselves healthy, unlike Robert Griffin did, and try to extend their career as far past their 30th birthday as possible. The drop-off is eventually coming, the key is to try to figure out when the drop might happen.


