As I've started the transition from baseball projections to football, the biggest hurdle is getting a decent understanding of playing-time variability. To find a solution, I had to create my own depth charts with handoff and target percentages. Basically, who's getting the touches.
With available data, I decided to base the initial target distribution on the quarterback's tendencies. A couple major red flags get thrown with this approach, but I will just have to live with them for now. While nearly every offensive snap must go through the quarterback, the coaches and other players influence the decision. Baby steps for now.
I would have loved to insert the head coach and/or offensive coordinator's previous tendencies, but I couldn't. I can't find a coaching database. All I must do is create a head, offensive and defensive coach database. It's on my to-do list. A ton of narratives could be answered with just this one database.
As for the surrounding cast of players, the solution is even harder. Someone would need to go back and guess each team's preseason intent for targeting players before the season began. It would be the same task I'm dealing with now. Preseason guesses versus actual game results.
Once the season starts,
As I've started the transition from baseball projections to football, the biggest hurdle is getting a decent understanding of playing-time variability. To find a solution, I had to create my own depth charts with handoff and target percentages. Basically, who's getting the touches.
With available data, I decided to base the initial target distribution on the quarterback's tendencies. A couple major red flags get thrown with this approach, but I will just have to live with them for now. While nearly every offensive snap must go through the quarterback, the coaches and other players influence the decision. Baby steps for now.
I would have loved to insert the head coach and/or offensive coordinator's previous tendencies, but I couldn't. I can't find a coaching database. All I must do is create a head, offensive and defensive coach database. It's on my to-do list. A ton of narratives could be answered with just this one database.
As for the surrounding cast of players, the solution is even harder. Someone would need to go back and guess each team's preseason intent for targeting players before the season began. It would be the same task I'm dealing with now. Preseason guesses versus actual game results.
Once the season starts, the projected targets can be refined but for now, all we can examine is past results.
Knowing my estimates would be off some, I moved ahead knowing I might have to later adjust some numbers.
My first order of business was to find the league-wide target rate for wide receivers, tight ends and running backs. The percentages worked out to:
WR: 58 percent
TE: 21 percent
RB: 21 percent
Or a simple 60/20/20 rule. Not every quarterback is going to follow these percentages exactly. Since 2014, here are the league-wide max and min values (min. 100 pass attempts).
| POS | MAX | MIN | STANDARD DEVIATION |
| WR | 73.3% | 40.8% | 6.4% |
| TE | 38.0% | 4.2% | 5.6% |
| RB | 35.3% | 8.8% | 4.8% |
Most of the targets quarterbacks are within five percentage points of the league average with few exceptions. Here is the overall distribution.
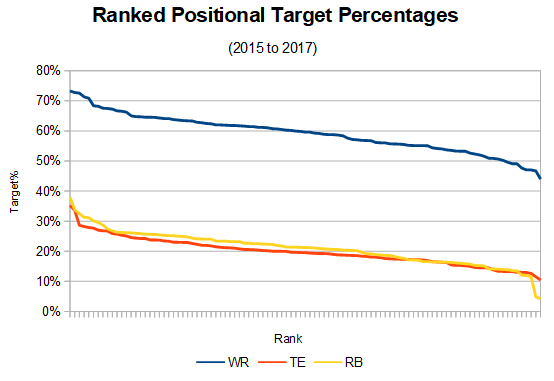
The slope is steady with just a few major exceptions.
Even with the most values hovering around the league average, I wanted to see if quarterbacks had any year-to-year influence on the distribution. To find out, I compared a quarterback's split from one season to the next.
Some year-to-year correlation exists. It takes about 600 pass attempts for a quarterback's projection to stabilize. Now, stabilize means half of the quarterback's target spread will be his previous season values and half will be the league average. For a predicted 2018 spread, no quarterback will get 50 percent of their previous season's spread. Tom Brady had the highest number of attempts at 581. Quite a bit of regression is baked in.
Using Brady as an example, here are his 2017 target rates and his projected 2018 values.
| SEASON | WR | TE | RB |
| 2017 | 47% | 26% | 27% |
| 2018 Proj. | 52% | 23% | 25% |
Brady stayed away from his wide receivers last year and it has been a trend for several seasons.
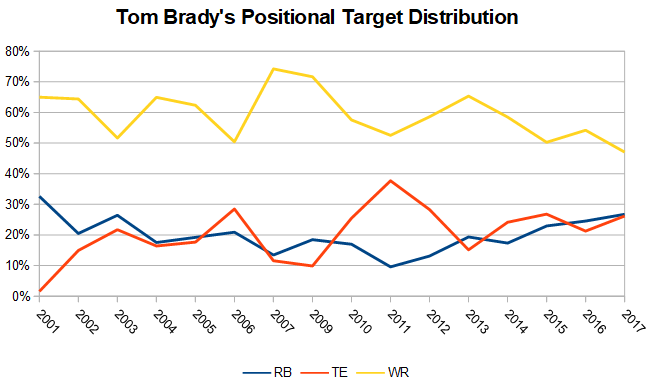
Brady's wide receiver split jumped around for years but has trended down the last few seasons. I'd still bet on some regression the wide receiver rate jumps up.
Another interesting quarterback to follow is Alex Smith. He's also thrown at a high right to his tight ends.
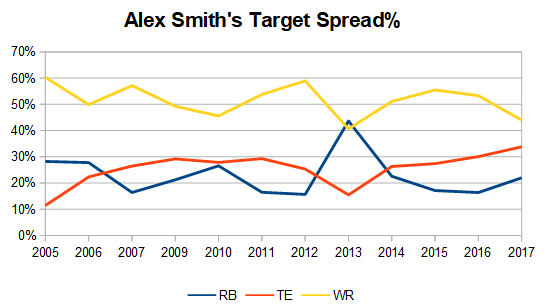
Even though his tight-end target rate won't be at 34 percent like last season, the projection has him around 27 percent. His high target rate should be good news for Jordan Reed and Vernon Davis as Smith should continue to rely on his tight ends.
And probably the biggest reason to understand these ratios is with a team like the New York Giants with the additions of Saquon Barkley, a healthy Odell Beckham, Cody Latimer and Russell Shepard. Eli Manning can only spread the ball around so much. Last season, he slightly favored his tight ends and running backs and comes into the season with a 54%/23%/23% projected target split. It'll be interesting to see if throws quite a bit to Barkley, which could boost his value even higher. Additionally, how will the targets be split between Beckham, Evan Engram and Sterling Shepard?
Besides the three quarterbacks listed, here are the projected splits for other quarterbacks in a sortable table. For those not listed, assume a 58/21/21 split.
| QB | WR | TE | RB |
|---|---|---|---|
| Aaron Rodgers | 62% | 22% | 16% |
| Alex Smith | 50% | 27% | 23% |
| Andy Dalton | 61% | 19% | 20% |
| Ben Roethlisberger | 61% | 19% | 20% |
| Blake Bortles | 58% | 18% | 23% |
| Brett Hundley | 64% | 17% | 19% |
| Brian Hoyer | 61% | 17% | 23% |
| C.J. Beathard | 50% | 19% | 31% |
| Cam Newton | 56% | 19% | 24% |
| Carson Palmer | 63% | 16% | 21% |
| Carson Wentz | 61% | 22% | 17% |
| Case Keenum | 59% | 20% | 21% |
| Dak Prescott | 62% | 21% | 18% |
| Derek Carr | 58% | 20% | 21% |
| Deshaun Watson | 61% | 21% | 18% |
| DeShone Kizer | 54% | 21% | 25% |
| Drew Brees | 56% | 17% | 27% |
| Eli Manning | 54% | 23% | 23% |
| Jacoby Brissett | 54% | 26% | 20% |
| Jameis Winston | 60% | 23% | 18% |
| Jared Goff | 61% | 19% | 20% |
| Jay Cutler | 64% | 18% | 18% |
| Joe Flacco | 53% | 22% | 25% |
| Josh McCown | 57% | 21% | 23% |
| Kirk Cousins | 56% | 22% | 21% |
| Marcus Mariota | 57% | 25% | 18% |
| Matt Ryan | 63% | 19% | 19% |
| Matthew Stafford | 58% | 21% | 21% |
| Mitchell Trubisky | 53% | 23% | 24% |
| Philip Rivers | 57% | 21% | 22% |
| Russell Wilson | 62% | 23% | 16% |
| Tom Brady | 52% | 23% | 25% |
| Tom Savage | 61% | 22% | 17% |
| Trevor Siemian | 62% | 19% | 19% |
| Tyrod Taylor | 52% | 23% | 26% |
Quarterbacks spread the ball around more than it seems, with non-wide receivers getting more than 40 percent of the league's targets. Quarterbacks have some year-to-year tendencies but when creating a projection, the values are heavily regressed. The ball will get spread around to a team's many targets. The expectations for everyone needs to be tempered in these instances.


