


Every July, about 70 of MLB's best players earn a well-deserved trip to the All-Star Game. Most of them are worse the rest of the way.
Using MLB's official data, RotoWire.com tracked every All-Star's numbers before and after the break across the last 10 All-Star Games -- 2015 through 2025, skipping the canceled 2020 event. The pattern is remarkably consistent: roughly seven in 10 All-Stars decline in the second half.

| Season | 1st-Half OPS | 2nd-Half OPS | Change | All-Stars |
|---|---|---|---|---|
| 2015 | .857 | .781 | −76 | 41 |
| 2016 | .891 | .789 | −102 | 42 |
| 2017 | .910 | .857 | −53 | 40 |
| 2018 | .885 | .813 | −72 | 40 |
| 2019 | .920 | .873 | −47 | 39 |
| 2021 | .877 | .835 | −42 | 39 |
| 2022 | .836 | .792 | −44 | 41 |
| 2023 | .856 | .821 | −35 | 40 |
| 2024 | .857 | .809 | −48 | 39 |
| 2025 | .871 | .797 | −74 | 39 |
| 2015–25 | .876 | .816 | −60 | 400 |
| Season | 1st-Half ERA | 2nd-Half ERA | Change | All-Stars |
|---|---|---|---|---|
| 2015 | 2.13 | 3.16 | +1.03 | 25 |
| 2016 | 2.41 | 3.37 | +0.96 | 23 |
| 2017 | 2.56 | 3.33 | +0.77 | 20 |
| 2018 | 2.39 | 2.85 | +0.46 | 21 |
| 2019 | 2.88 | 3.31 | +0.43 | 17 |
| 2021 | 2.59 | 3.66 | +1.07 | 18 |
| 2022 | 2.19 | 2.78 | +0.59 | 17 |
| 2023 | 2.88 | 4.03 | +1.15 | 20 |
| 2024 | 2.35 | 3.09 | +0.74 | 20 |
| 2025 | 2.72 | 3.52 | +0.80 | 18 |
| 2015–25 | 2.49 | 3.31 | +0.82 | 199 |
Do MLB All-Stars slump in the second half?
In short, yes -- and it isn't close. Of the 400 qualified All-Star hitters over the last decade, 277 (69%) posted a lower OPS after the break.
Among 199 qualified All-Star pitchers, 138 (69%) saw their ERA rise. The effect showed up in all 10 seasons studied. Not once did the All-Star class, as a group, get better after the break.
How much do All-Star hitters decline after the break?
The average All-Star hitter went from a .876 OPS before the break to .816 after -- a drop of 60 points. That's roughly the gap between an All-Star-caliber bat and a merely solid regular. The fade was steepest in 2016 (.891 to .789, a 102-point fall) and gentlest in 2023 (.856 to .821), but every single season bent the same way.
How much do All-Star pitchers fall off after the break?
Pitchers slid even further in relative terms. The average All-Star arm carried a 2.49 ERA into the break and a 3.31 ERA out of it -- a jump of 0.82. Twelve of the pitchers who made an All-Star team over this span barely appeared afterward, sidelined by injury -- a reminder that heavy first-half workloads sometimes come due. Keep up with MLB injuries all season long here.
The sharpest collapse belonged to Fernando Rodney in 2016, who followed a microscopic 0.31 first-half ERA with a 6.16 mark after the break. Lance McCullers Jr. paired a 3.05 first half in 2017 with an 8.23 finish.
Why do All-Stars slump after the break?
Before anyone blames the Home Run Derby or the layoff, consider why players make the team in the first place: they were selected because they ran hot for half a season. Very few hitters truly sustain a .876 OPS, and even fewer pitchers hold a sub-2.50 ERA across a full year. When a player is chosen precisely for an outlier stretch, some cooling off is the expected outcome -- not a jinx. The break doesn't cause the slump; the selection process does. Layer in second-half fatigue and the occasional injury, and the drop is largely baked in.
Which All-Stars beat the second-half slump?
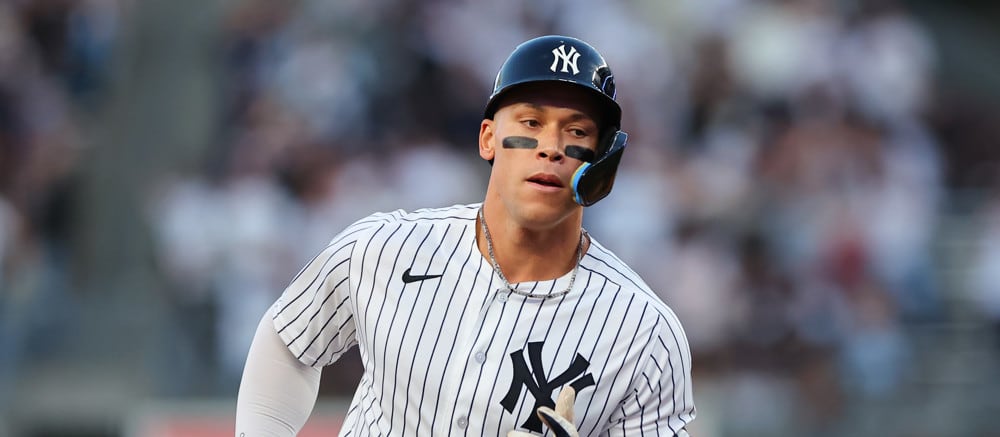
Plenty of stars still surged. Albert Pujols turned a quiet .677 first half in 2022 into a 1.103 OPS down the stretch on his farewell push to 700 home runs. Christian Yelich (.823 to 1.219 in 2018) and Aaron Judge (.982 to 1.286 in 2022) used their second halves to fuel MVP and record-chasing runs. On the mound, Stephen Strasburg (3.43 to 0.86 in 2017), Jacob deGrom (3.27 to 1.44 in 2019) and Clayton Kershaw (2.85 to 1.31 in 2015) all sharpened after the break. The slump is a strong tendency, not a rule.
What the All-Star slump means for fantasy baseball
The takeaway for MLB fantasy isn't to fade every All-Star -- it's to expect the group to regress toward its true level. A first-half OPS or ERA built on an unsustainable peak is a warning sign; production grounded in skills, batted-ball quality and track record is far more likely to hold. For fantasy managers weighing a buy-low or sell-high move at the trade deadline, that distinction is the whole game.
How we measured it
We pulled every player on each All-Star Game roster from 2015 to 2025 (excluding 2020, when no game was played) using MLB's official Stats API. "First half" covers Opening Day through the day before the All-Star
game; "second half" runs from the day after through the end of the regular season, postseason excluded. Hitters are measured by OPS, pitchers by ERA. To keep the comparison fair, we included only hitters with at least 40 plate appearances in each half (400 players) and pitchers with at least 25 innings in each half (199 players). Reported averages are the mean of individual players' rates.
Think you know your MLB All-Star Game history? Make time for our latest interactive game that looks back on a player's votes in a particular season.
Frequently asked questions
Do baseball players get worse after the All-Star break?
All-Stars specifically tend to. Over the last 10 seasons, about 69% of All-Star hitters and 69% of All-Star pitchers posted worse numbers in the second half. This mostly reflects regression to the mean rather than any effect of the break itself.
Is the All-Star Game a curse?
No. Players are chosen for the All-Star team because of exceptional first halves that are hard to sustain, so a step back is statistically expected. There is no evidence that the game or the break causes the decline.
Which All-Stars improved the most after the break?
Recent standouts include Albert Pujols (2022) and Christian Yelich (2018) among hitters, and Stephen Strasburg (2017) and Jacob deGrom (2019) among pitchers — all of whom got substantially better down the stretch.
Data: MLB Stats API. All-Star Game rosters, 2015–2025 (no 2020 game). Regular season only. Figures verified against official MLB records.