Last week, we determined wide receivers likely have no predictable red zone "ability." The study was limited to season-to-season and 20-yards-or-less information. I decided to expand the study to include different yards-to-goal and in-season. The results didn't change.
To start with, I looked to see if taller wide receivers got targeted more as a team got closer to the goal line, as many fans and analysts consider tall receivers to be end-zone targets.
Initially, I found receiver height wasn't a red-zone factor. I expanded the work to move closer and further away from the end zone. Here are the average receiver height and weight for different yards to go.
| YARDS TO GO | HEIGHT | WEIGHT |
| 75 or less | 72.7 | 202.5 |
| 50 or less | 72.7 | 202.6 |
| 25 or less | 72.8 | 202.8 |
| 20 or less | 72.8 | 202.9 |
| 15 or less | 72.8 | 202.9 |
| 10 or less | 72.8 | 203.0 |
| 5 or less | 72.8 | 203.1 |
There is just nothing useable in the data. No major difference exists in targeted wide receiver height and weight as a team gets closer to the end zone.
Besides the average height, maybe a subset of taller players gets targeted and can catch the ball more. Here are how individual heights matter for targets and completion rates.
First, here's completion rate chart.

The completion rates generally stay the same except when the sample sizes start to shrink (e.g. less than 15 and for players less than 6-foot). There is nothing pointing to the taller players being better. If anything, they
To start with, I looked to see if taller wide receivers got targeted more as a team got closer to the goal line, as many fans and analysts consider tall receivers to be end-zone targets.
Initially, I found receiver height wasn't a red-zone factor. I expanded the work to move closer and further away from the end zone. Here are the average receiver height and weight for different yards to go.
| YARDS TO GO | HEIGHT | WEIGHT |
| 75 or less | 72.7 | 202.5 |
| 50 or less | 72.7 | 202.6 |
| 25 or less | 72.8 | 202.8 |
| 20 or less | 72.8 | 202.9 |
| 15 or less | 72.8 | 202.9 |
| 10 or less | 72.8 | 203.0 |
| 5 or less | 72.8 | 203.1 |
There is just nothing useable in the data. No major difference exists in targeted wide receiver height and weight as a team gets closer to the end zone.
Besides the average height, maybe a subset of taller players gets targeted and can catch the ball more. Here are how individual heights matter for targets and completion rates.
First, here's completion rate chart.

The completion rates generally stay the same except when the sample sizes start to shrink (e.g. less than 15 and for players less than 6-foot). There is nothing pointing to the taller players being better. If anything, they get worse the closer a team gets to the end zone.
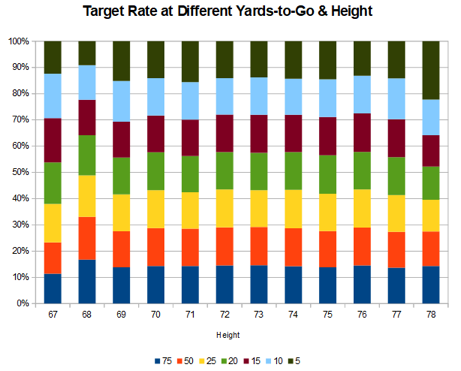
I will start out by apologizing for the following graph. It's not the best chart, but it's better than the other ones I could have used. The reason is height doesn't matter with target rate.

In this chart, the heights are divided into seven increments with each yardage marker being divided into ~14 percent to 15 percent increments. Except for the 78-inch receivers at five or fewer yards. It's more than 20 percent. Now, look at the completion rate graph. The completion rate for these taller receivers is the lowest of any subset. It's like the defense knows the tall guy is getting targeted near the end zone. I think wide receiver height can be put to bed as a red-zone factor to consider.
Now, can red-zone targets be predictive from season to season? Last week, it was a no at 20 yards. I decided to do a few more increments this week to see if the correlations increase as a team gets closer to scoring.
I matched up seasons where the receiver averaged two receptions per game. One small change from last time, I did the reception rate near the end zone and for the rest of the field. Previously, it was the entire field.
I'm trying to find out if teams utilize certain receivers in the red zone more than or less than normal. Last week, there was a small correlation, and it didn't change this week. Here are the r-square values for receivers in the red zone and for the rest-of-field targets (0 = no correlation, 1= perfect correlation).
| YARDS OR LESS TO GO | R-SQUARED |
| 25 | 0.08 |
| 20 | 0.06 |
| 15 | 0.01 |
| 10 | 0.01 |
| 5 | 0.01 |
I thought the 20-yard values were bad, but the correlation just gets worse as the team near the goal line.
Now one more test. What if there exists an elite class of end-zone targets. To find out, I set the year-1 targets to certain minimum thresholds and looked to see if the targets continued.
| YARDS OR LESS TO GO | MIN TARGETS (YEAR 1) | R-SQUARED |
| 10 | 2 | 0.00 |
| 10 | 4 | 0.00 |
| 10 | 6 | 0.01 |
| 10 | 8 | 0.00 |
| 5 | 2 | 0.02 |
| 5 | 4 | 0.05 |
While some correlation exists at five yards to go, its minuscule otherwise.
Nothing red-zone related is useable from season to season. Finding no correlation from season to season will help owners remove any offseason red zone noise and concentrate on usable information. One final question remains, is it predictable in-season?
Using the same two-target per game average, the in-season values again aren't predictable. Using the standard 20-yard increment, the r-squared of the first half to second half red-zone targets is 0.08. Not much at all and the same as the year-to-year values. If the first 12 games are used and compare them to the last four, the r-squared is 0.07. Just nothing predictive.
Again, I'll emphasize one point: a good receiver is good anywhere on the field. Some might not get may red-zone opportunities. The reason is that few opportunities exist. Receivers are targeted 80 percent less in the red zone compared to the rest of the field. Fantasy owners must make sure the wide receiver is getting targeted, has good hands and can hopefully find the end zone. That's it.
As always, let me know if you have any comments or questions. Next week I'm off to examine running backs in the red zone.


