While I eventually decided to use contact (Contact%) and swing (Swing%) rates, I dug around a bit see what other stats could be used. Bottlecap brought up "deterioration in vision" and "bat speed." The problem with these two data sources is it takes knowing the hitter's vision test or multiple years of scouting reports to get the information.
The key was to find an easy to follow source on the information, and I used the Pitchf/x Plate Discipline values available at FanGraphs (here's Carlos Gomez's, for example). I will look at the three swinging and three contact values to see which ones might indicate a change in a player's performance. The reason I like to use the Pitchf/x plate discipline values instead of the normal "Plate Discipline" values (just above the linked table) is the strike zone size was inconsistent for several years.
Besides being readily available in a simple table at FanGraphs, both of the stats stabilize at a quicker rate
While I eventually decided to use contact (Contact%) and swing (Swing%) rates, I dug around a bit see what other stats could be used. Bottlecap brought up "deterioration in vision" and "bat speed." The problem with these two data sources is it takes knowing the hitter's vision test or multiple years of scouting reports to get the information.
The key was to find an easy to follow source on the information, and I used the Pitchf/x Plate Discipline values available at FanGraphs (here's Carlos Gomez's, for example). I will look at the three swinging and three contact values to see which ones might indicate a change in a player's performance. The reason I like to use the Pitchf/x plate discipline values instead of the normal "Plate Discipline" values (just above the linked table) is the strike zone size was inconsistent for several years.
Besides being readily available in a simple table at FanGraphs, both of the stats stabilize at a quicker rate than any other hitting related stat. According to FanGraphs' Eric Seidman, Swing% stabilizes in 50 PA (half a month of PA) and Contact% in 100 PA (month of PA). With the stabilization point so low, a hitter can make a midseason change (like getting healthy) and the adjustments can be quickly seen. So, using hitter K%-BB% as our proxy for plate discipline, which of the above values correlates to K%-BB% and its components using R-Squared values? A value of 1 means the values have perfect correlation while a value of 0 means no correlation.
Note: Having a "Z" in front of Contact% and Swing% means the pitches in question were in the strike zone, while an "O" in front means the pitches were out of the zone.
| STAT | O-CONTACT% | Z-CONTACT% | CONTACT% | O-SWING% | Z-SWING% | SWING% |
| K% | .64 | .67 | .77 | .00 | .02 | .00 |
| BB% | .03 | .04 | .01 | .45 | .08 | .38 |
| K%-BB% | .53 | .54 | .68 | .08 | .07 | .09 |
Strikeout rate (K%) is highly correlated with all three contact values, but especially the overall value. The decision to swing inside or out of the zone has almost no correlation, though. I ran the numbers and a 1 percentage point change in Contact% equals a 1 percentage point change in K%. With walk rate (BB%), the key value is O-Swing%, which makes sense because being able to judge what is and isn't a strike is important. A 1 percentage point change in O-Swing% equates to a 0.33 percentage point change in BB%. When K% and BB% are combined, the Contact% value dominates.
Going back to last week's article, Brandon Belt has seen the biggest change in K%-BB% with his K% dropping nine points (30 to 21 percent) and his BB% increasing four points (10 to 14 percent). Most of the change can be explained with his O-swing% going from 29 to 25 percent and his Contact% going from 74 to 78 percent.
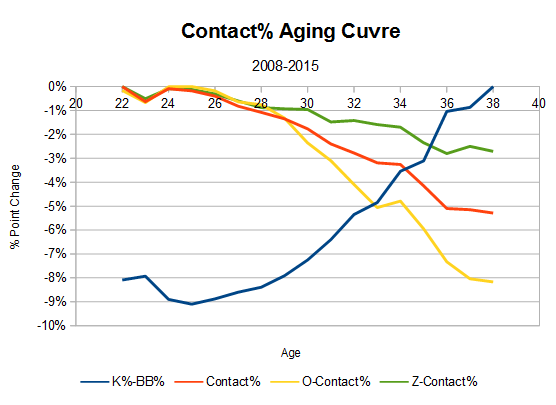
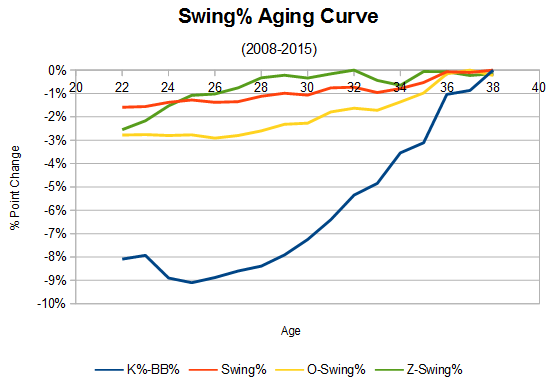
The one other item I looked at in the previous article was when to expect players to see their plate discipline decline using aging curves. I decided to go ahead and create aging curves again for the above six stats. Additionally, I have added the K%-BB% aging curve for reference.
The aging curve was created by the delta method by weighting plate appearances using their harmonic means. With this method, there's a small survivor bias, which was summarized in an article by Mitchel Lichtman at The Hardball Times:
"I have also explained the problem of survivor bias, an inherent defect in the delta method, which is that the pool of players who see the light of day at the end of a season (and live to play another day the following year) tend to have gotten lucky in Year 1 and will see a "false" drop in Year 2 even if their true talent were to remain the same. This survivor bias will tend to push down the overall peak age and magnify the decrease in performance (or mitigate the increase) at all age intervals."


The key point to take from the two graphs is that the two most significant plate discipline factors, O-swing% and Contact%, almost immediately start getting worse leading to the players' worsening of K%-BB%. The change in O-swing% is not as much as Contact%, be the change doesn't help to offset the other changes.
Looking at the graphs a little more, there seemed to be different aging rates for the stats. I went ahead and lumped the change in values by five-year increments here:
| AGE | K%-BB% | SWING% | 0-SWING% | Z-SWING% | CONTACT% | 0-CONTACT% | Z-CONTACT% | 23-27 | -0.5 | 0.2 | 0.0 | 1.8 | -0.8 | -0.5 | -0.6 | 28-32 | 3.3 | 0.6 | 1.2 | 0.8 | -2.0 | -3.5 | -0.8 | 33-37 | 4.0 | 0.9 | 1.6 | 1.6 | -3.2 | -4.4 | -1.7 |
The biggest change with the 28-32 age group is the drop in Contact% led by a drop in O-Contact%. The key factor to follow for a hitter's decline near 30 years old is his O-Contact%.
Another point to keep in mind is the 33-year-olds and older have an overall decline with hitters swinging out of the zone more and really having problems making contact with those pitches.
Now we know how and when Contact% and Swing% lead to changes in strikeout and walk rates, but how do we apply these findings to a hitter like Carlos Gomez?
Gomez has had a horrible season, with plate discipline the leading cause. While his BB% has seen a small increase, his K% has jumped from 21 to 32 percent. This change is not a surprise with his Contact% going from 77 to 67 percent. As the previous article showed, his Contact% was down at 65 percent.
Let's check if he is improving by using the previously stated stabilization rates.
For Contact%, a month of data (100 PA) is needed to get a decent sample. Go to FanGraph's Game Log page, use the date selector to pick the last month's data.
Over the last month, his contact rate is 72 percent. Before then, it was 63 percent. Recently, Gomez has trended up and it may be a time to jump back in and take a chance on him. He had several injuries that bugged him (hip, hamstring, wrist, intercostal) and looks like he might finally be feeling better (hitting .269/.352/.452) with room for improvement.
With all the preceding information, I think the following are the key points:
• When looking at changes in K%, look for movement in Contact%. A 1 percentage point change in Contact% equals a 1 percentage point change in K% in the opposite direction.
• When looking at changes in BB%, look for movement in O-Swing%. A 1 percentage point change in O-Swing% equals a .33 percentage point change in BB% in the opposite direction.
• Hitters begin to see their plate discipline drop starting about age 28, with O-Contact% the leading cause. At age 33, the decline happens even more rapidly.
Hopefully, I've answered Bottlecap's question on plate discipline. While there was a lot of information, all of it comes down those three simple rules, in my opinion. With this information, players can be examined to see if changes are permanent or if the hitter is adjusting. As always, let me know if you have any questions.


