Dear Mr. Barber:
I shouldn't have done it, but I did. I fell for some social media clickbait and checked out, Tiki: Tommy Pham's success should be lesson to Mets that 'analytics suck'. I guess I was curious if the Tiki in the title is indeed Tiki Barber, because, you know, if it is, I have been remiss not following you for your baseball takes (insert eye roll here).
Yup, it's you. First off, thanks for being part of a couple of fantasy football championships. Not mine, but I'm sure someone must have drafted you and still won their league. Or maybe they drafted the Tampa Bay defense, so they sort of had your brother on their team.
To be upfront, I understand sports talk radio. You need ratings, especially in New York. Saying polarizing things gets eardrums. I get it. Sometimes those things have no basis in fact. It's part of the deal. I don't know, it just bugs me when people get paid to knowingly say dumb things, or are too lazy to learn what's right, and that was exactly the case here. I'm sorry, but your rant on Tommy Pham was inane.
That said, this letter isn't about Pham per se, but about explaining the fallacy in your diatribe, then offering some salient means of analyzing baseball players.
The crux of your argument was that the Mets' number crunchers suggested Pham should sit against right-handed pitching. However, because of a sample of fewer than 80 plate
Dear Mr. Barber:
I shouldn't have done it, but I did. I fell for some social media clickbait and checked out, Tiki: Tommy Pham's success should be lesson to Mets that 'analytics suck'. I guess I was curious if the Tiki in the title is indeed Tiki Barber, because, you know, if it is, I have been remiss not following you for your baseball takes (insert eye roll here).
Yup, it's you. First off, thanks for being part of a couple of fantasy football championships. Not mine, but I'm sure someone must have drafted you and still won their league. Or maybe they drafted the Tampa Bay defense, so they sort of had your brother on their team.
To be upfront, I understand sports talk radio. You need ratings, especially in New York. Saying polarizing things gets eardrums. I get it. Sometimes those things have no basis in fact. It's part of the deal. I don't know, it just bugs me when people get paid to knowingly say dumb things, or are too lazy to learn what's right, and that was exactly the case here. I'm sorry, but your rant on Tommy Pham was inane.
That said, this letter isn't about Pham per se, but about explaining the fallacy in your diatribe, then offering some salient means of analyzing baseball players.
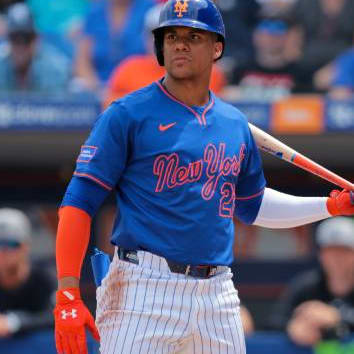
The crux of your argument was that the Mets' number crunchers suggested Pham should sit against right-handed pitching. However, because of a sample of fewer than 80 plate appearances, you decreed, "analytics sucks."
There was a time Pham was effective facing right-handed pitching, but heading into this season, he's recorded a .333 wOBA facing southpaws since 2020 and a .299 mark versus right-handers. League average for right-handed hitters in this span was .326 against lefties and .310 facing righties. In other words, for the past three seasons, Pham was barely useful serving on the less busy side of a platoon. He was detrimental when in the box with a right-hander on the hill.
Through June 19, Pham had registered a .358 wOBA against righties, well above league average, to say nothing of what he's generated in that split in recent seasons. To his credit, he'd fanned at a solid 19.8 percent rate against righties, compared to a 24.7 percent mark against lefties. However, his production was driven by a .321 BABIP against right-handers, his highest in this scenario since 2018. His mark from 2019-2022 was .282. What are the chances he sustains a level 40 points higher than what he's done since 2019?
Here, let me help you. His average exit velocity facing right-handers is up a few ticks. This is excellent, and in fact bodes well for continued success. That is, maybe Pham can maintain elevated production without the platoon edge. We know this because of... wait for it... analytics.
I know, your point is that Buck Showalter needs to be able to use his experience to manage, and not a bunch of printouts. Well, one of the major points of the piece was the Mets presenting Pham with the recent data, and the player using it as a motivating factor. As a former athlete, Mr. Barber, you no doubt agree with this narrative, and I'm in no position to object. However, we're both naive if we believe Pham was the only player receiving some form of pep talk in the spring. How is everyone else faring?
Mr. Barber, the irony is Pham's full-time role is completely supported by analytics. Often, when a player exhibits a spike in performance of this nature, there is far less support than improved contact and hitting the ball with more authority. In fact, the small sample bump is usually happenstance, with regression expected. In this case, there is no guarantee Pham maintains his current pace, but any giveback won't be due to regression, but a decline in skills.
Again, I understand your agenda is to ruffle feathers, and claiming analytics sucks does just that. I just wish instead, you and others in your position would make the effort to educate, and not just say dumbass things for ratings. Some people actually listen, and some even believe what you say.
To be clear, Mr. Barber, you aren't alone. It drives me goofy how play-by-play broadcasters spew batter versus pitcher data as if it is meaningful, often citing outcomes from just a handful of plate appearances. This is but one example. The linked piece was simply low-hanging fruit and as a writer, I was pining for a unique approach to my column.
I suppose I should apologize for seemingly directing my frustration at you. You're simply the exemplar of a more widespread problem. It's hard to dole out some fantasy baseball advice when the reply is, "But I heard so-and-so say...", and the person being cited is a former player or respected broadcaster.
I doubt I have moved you to dig into analytics, but since I was trained via the motto, "Don't come to me with a problem; come with a solution", here are some jumping-off points if you want to speak intelligibly on player analysis. All of this information is publicly available on Statcast, Fangraphs and Baseball Reference.
Most analysts like to compare expected stats to actual, such as batting average, weighted on base average (wOBA) or even homers. This isn't a bad place to start, but there are shortcomings to this approach since expected stats don't always properly account for factors like home parks or some specific player traits, but it's a nice place to begin the deeper dive.
When xBA and batting average don't mesh, the first thing to do is compare hard hit rate to BABIP. The correlation isn't perfect -- last season's it was .74 -- but that's sufficient to look into any outliers. The following is a table giving the BABIP to expect for the associated HardHit%. Again, it's not exact, but if the player's actual BABIP is significantly different, some regression can be expected.
| HardHit% | BABIP |
|---|---|
| 60.0% | 0.397 |
| 59.0% | 0.392 |
| 58.0% | 0.387 |
| 57.0% | 0.382 |
| 56.0% | 0.377 |
| 55.0% | 0.372 |
| 54.0% | 0.367 |
| 53.0% | 0.362 |
| 52.0% | 0.357 |
| 51.0% | 0.352 |
| 50.0% | 0.347 |
| 49.0% | 0.342 |
| 48.0% | 0.336 |
| 47.0% | 0.331 |
| 46.0% | 0.326 |
| 45.0% | 0.321 |
| 44.0% | 0.316 |
| 43.0% | 0.311 |
| 42.0% | 0.306 |
| 41.0% | 0.301 |
| 40.0% | 0.296 |
| 39.0% | 0.291 |
| 38.0% | 0.286 |
| 37.0% | 0.281 |
| 36.0% | 0.276 |
| 35.0% | 0.271 |
| 34.0% | 0.265 |
| 33.0% | 0.260 |
| 32.0% | 0.255 |
| 31.0% | 0.250 |
| 30.0% | 0.245 |
| 29.0% | 0.240 |
| 28.0% | 0.235 |
| 27.0% | 0.230 |
| 26.0% | 0.225 |
| 25.0% | 0.220 |
| 24.0% | 0.215 |
| 23.0% | 0.210 |
| 22.0% | 0.205 |
| 21.0% | 0.200 |
| 20.0% | 0.195 |
Let's circle back to Pham. Through Thursday's action, Pham's xBA according to Statcast is .298, compared to his actual .260 mark. Sure enough, his 51.4 percent HardHit rate portends to a BABIP around .354. We each have different agendas and target audiences, but Mr. Barber, explaining to your audience that Pham has actually hit into some bad luck would be a more beneficial use of your platform, though your bosses may not agree.
Here is another straightforward means of player evaluation. Go to the Statcast Home Run Leaderboard to gauge which batters should have slugged more homers. Currently, Jose Ramirez is at the top of the list. Sure, it's OK to simply point out he's been unlucky, but it's always nice to look under the hood.
Barrel rate is a leading indicator for homers. Last season's correlation between Barrel Rate and Homers per Plate appearance was .86. Here is a chart equating Barrel% with HR/PA:
| Barrel% | HR/PA |
|---|---|
| 15 | 0.090 |
| 14.5 | 0.087 |
| 14 | 0.084 |
| 13.5 | 0.081 |
| 13 | 0.077 |
| 12.5 | 0.074 |
| 12 | 0.071 |
| 11.5 | 0.068 |
| 11 | 0.065 |
| 10.5 | 0.062 |
| 10 | 0.059 |
| 9.5 | 0.056 |
| 9 | 0.052 |
| 8.5 | 0.049 |
| 8 | 0.046 |
| 7.5 | 0.043 |
| 7 | 0.040 |
| 6.5 | 0.037 |
| 6 | 0.034 |
| 5.5 | 0.030 |
| 5 | 0.027 |
| 4.5 | 0.024 |
| 4 | 0.021 |
| 3.5 | 0.018 |
| 3 | 0.015 |
| 2.5 | 0.012 |
| 2 | 0.009 |
Ramirez's current Barrel Rate is 7.9 percent, so he should club around .045 homers per trip to the dish. He's had 314 plate appearances, so based on barrels, Ramirez should have 14 homers. Instead he has 11, so the inference is his long ball pace should pick up, assuming the same level of barrels.
I ask you, Mr. Barber, do analytics still suck?
Here is one more quick test to help pinpoint players whose production should improve. I know you'll find this hard to believe, but the notion that some players consistently perform better in the clutch is mostly bunk. Sure, there is research showing that some people could be better able to handle pressure, but by and large, clutch hitting is a myth. If a player's RBI total seems low, check out his batting average with runners in scoring position. While it doesn't manifest for every player, overall, batting average with runners in scoring position is a bit higher than their average since pitchers often are working from the stretch, which results in a higher BABIP.
For example, let's look at Austin Riley. Here is his Baseball Reference Page with 2023 splits. Toggle down to Bases Occupied. His batting average is .143 with runners in scoring position, explaining why he has only 35 RBI even though he's hit a reasonable 12 homers and sits in the heart of the order for a productive offense. Riley didn't forget how to hit with men on base; it's just a small sample anomaly, and once it regresses, he should compile RBI at a more normal rate.
Mr. Barber, my guess is you, and others in a similar position, will continue to strive for ratings over edifying your audience. However, there is no reason those paid to provide color commentary or pre- and post-game analysis can't do their homework.
Sincerely,
Todd Zola


