Before we begin, a warning: this article will not answer the question posed in the title.
But I hope it at least offers the groundwork to begin an attempt to find the answer. While it's not particularly hard to determine roughly how good the drafting public collectively is at player evaluation — just compare year-end earned value to ADP and you'll find that while we miss on plenty of players, we generally do manage to draft the good players before the bad ones — there's no simple way to test whether or not we're any good at evaluating injury risk.
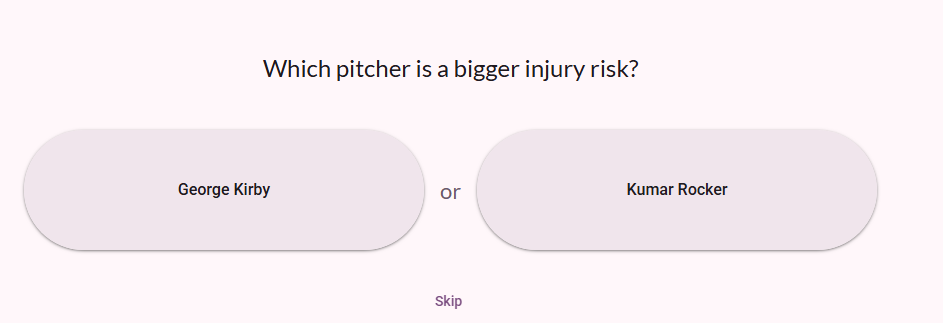
There might be a complicated way, however. Back in December, I used a website called All Our Ideas to create what it calls a "Wiki Survey" and sent it to leaguemates, fellow RotoWire colleagues and members of the RotoWire Discord server. The survey presented respondents with two pitchers from among the top-85 starting pitchers by NFBC ADP at the time it was created and asked the simple question, "Which pitcher is a bigger injury risk?"
Respondents could continue for as many pairs of pitchers as they chose. I ended up collecting votes on over 2,000 individual matchups over the course of about two weeks, an average of over 50 matchups per player. (I wanted to cut the answers off well before pitchers reported to camp and revealed new information about their arms.)
The site creates a ranked list based not just on each pitcher's win/loss record in these matchups but
Before we begin, a warning: this article will not answer the question posed in the title.
But I hope it at least offers the groundwork to begin an attempt to find the answer. While it's not particularly hard to determine roughly how good the drafting public collectively is at player evaluation — just compare year-end earned value to ADP and you'll find that while we miss on plenty of players, we generally do manage to draft the good players before the bad ones — there's no simple way to test whether or not we're any good at evaluating injury risk.
There might be a complicated way, however. Back in December, I used a website called All Our Ideas to create what it calls a "Wiki Survey" and sent it to leaguemates, fellow RotoWire colleagues and members of the RotoWire Discord server. The survey presented respondents with two pitchers from among the top-85 starting pitchers by NFBC ADP at the time it was created and asked the simple question, "Which pitcher is a bigger injury risk?"
Respondents could continue for as many pairs of pitchers as they chose. I ended up collecting votes on over 2,000 individual matchups over the course of about two weeks, an average of over 50 matchups per player. (I wanted to cut the answers off well before pitchers reported to camp and revealed new information about their arms.)
The site creates a ranked list based not just on each pitcher's win/loss record in these matchups but also based on which opponents they've been matched up against, similar to what you'd expect from an ELO scoring system. At least, that appears to be what it's doing. The creators of All Our Ideas prefer buzzwords over detailed descriptions of their methodology, but the results it produces are intuitive enough, and it sorted players pretty close to how I'd expect them to be sorted before too long.
I then split the ranked list of 85 players in five equal tiers and assigned each tier a letter grade. Here are those grades, but fair warning: these are not intended to be an accurate assessment of each pitcher's actual injury risk. Instead, consider them an assessment of the pitcher's perceived injury risk. We haven't even begun the study to figure out whether this perception is worth anything.
With the grades in hand, I waited. Now that spring training has come and gone, we have the first opportunity to test whether the public (at least one specific subset of the public) is any good at predicting which pitchers are injury risks and which are safe.
Let's take a look at which members of each tier will be opening the year on the injured list:
- Tier A (2): George Kirby (shoulder), Brayan Bello (shoulder)
- Tier B (1): Ranger Suarez (back)
- Tier C (5): Kutter Crawford (knee), Sean Manaea (oblique), Clarke Schmidt (shoulder), Luis Gil (lat), Jared Jones (elbow)
- Tier D (4): Grayson Rodriguez (elbow), Gerrit Cole (elbow), Yu Darvish (elbow), Spencer Strider (elbow)
- Tier F (2): Shane McClanahan (triceps), Brandon Woodruff (shoulder)
So that's B-grade pitchers in the lead, followed by both A and F tied for second, then a jump to D in fourth, with C coming in last. Avoid all moderately healthy pitchers, is that the takeaway from this study? Probably not, for three reasons.
First, it's still early — maybe even earlier than early. We have to the play the season out first. There's plenty of time for the Ds and Fs to take their supposedly rightful crown as the biggest injury risks in the player pool.
Second, take a look at the types of injuries in that D tier: elbow, elbow, elbow, elbow. That's the sort of injury designation that tends to keep a pitcher on the sidelines for a very long time. In Cole's case, we won't see him until the middle of next season. I'll be tracking the total innings pitched by each of these tiers throughout the season, and the tiers full of pitchers who suffer elbow injuries will almost certainly rank below the tiers full of pitchers who suffer back, knee and oblique injuries.
Third, at least two of the injured pitchers in the C tier don't look like they belong there, and I'd like to think that's something I'm saying not just with the benefit of hindsight. Both Gil and Jones are flamethrowers, and high velocity sure looks as though it correlates with injury risk. Both pitchers also had notable recent injuries, even if they were healthy when the survey was conducted. Gil's Tommy John surgery cost him most of 2022 and all of 2023, while Jones missed almost two months with a lat injury last year and wasn't the same after he returned.
It's likely neither Gil nor Jones would have graded higher than a D had I opened the survey up to more participants, though perhaps I'm wrong. There aren't too many Ds who I'd be all that comfortable bumping up to C to take their place. But in any case, if this experiment gains any traction, I'd be inclined to repeat it next offseason with a larger pool of participants, and perhaps the grades would then be a fairer reflection of the public perception of injury risk.
So, are we any good at predicting pitcher injuries? So far, the answer is "maybe." I'll track each group's innings pitched and time spent on the injured list throughout the year, and we'll see how my group of survey respondents did. If they did well, maybe we'll repeat the experiment with more responses and start to figure out whether the public perception of injury risk really is worth paying attention to.
Or maybe Logan Webb, Aaron Nola and Framber Valdez will join George Kirby on the injured list tomorrow.